
What's Driving Rural Population Growth?
Population decline is a familiar story for many rural areas and small towns: Children grow up and leave for college or move to a larger city with more job opportunities. With fewer working-age adults left, some rural employers might leave as well, and new businesses may be reluctant to move in. This self-reinforcing cycle of population decline can continue for decades.
In the Fifth District, counties that are today considered small towns or rural are more likely than urban counties to have been shedding population for three or more of the decades between 1970 and 2020. In contrast, about 63 percent of counties that grew in each of those five decades are urban. (See chart.) The term "rural" refers to counties with a U.S. Department of Agriculture Rural-Urban Continuum Code (RUCC) of 3 or greater, and "urban" refers to counties with a RUCC of 1 or 2. (For more on rural definitions, see "Definitions Matter: The Rural-Urban Dichotomy," Econ Focus, Third Quarter 2018.)
While rural areas are more likely than urban places to have a shrinking population, some have bucked this trend. About a quarter of the rural counties in the Fifth District saw five straight decades of growth between 1970 and 2020. Of those that declined, about 40 percent only lost population in one or two of the last five decades. For nearly all of those counties, one period of decline was between 2010 to 2020, the decade following the Great Recession.
Population growth has continued in almost 90 percent of the rural areas that were growing between 1970 and 2020. Additionally, about 40 percent of counties that lost population between 2010 and 2020 have started growing again. Some rural counties that experienced more long-term decline have also started growing in recent years. What do these growing rural counties have in common? And is there a formula for success?
Demographics of Population Growth
The population of the United States is aging, and while rural areas tend to have higher concentrations of older adults, both rural and urban places have seen their share of residents over the age of 65 increase in recent years. Rural counties in the Fifth District saw an average increase of about 6 percent in this group between 2020 and 2023, while urban counties saw an average increase of about 10 percent. Growth in the senior population doesn't necessarily mean that more retirees are moving to these places; it could simply be the result of residents aging in place, or a combination of both.
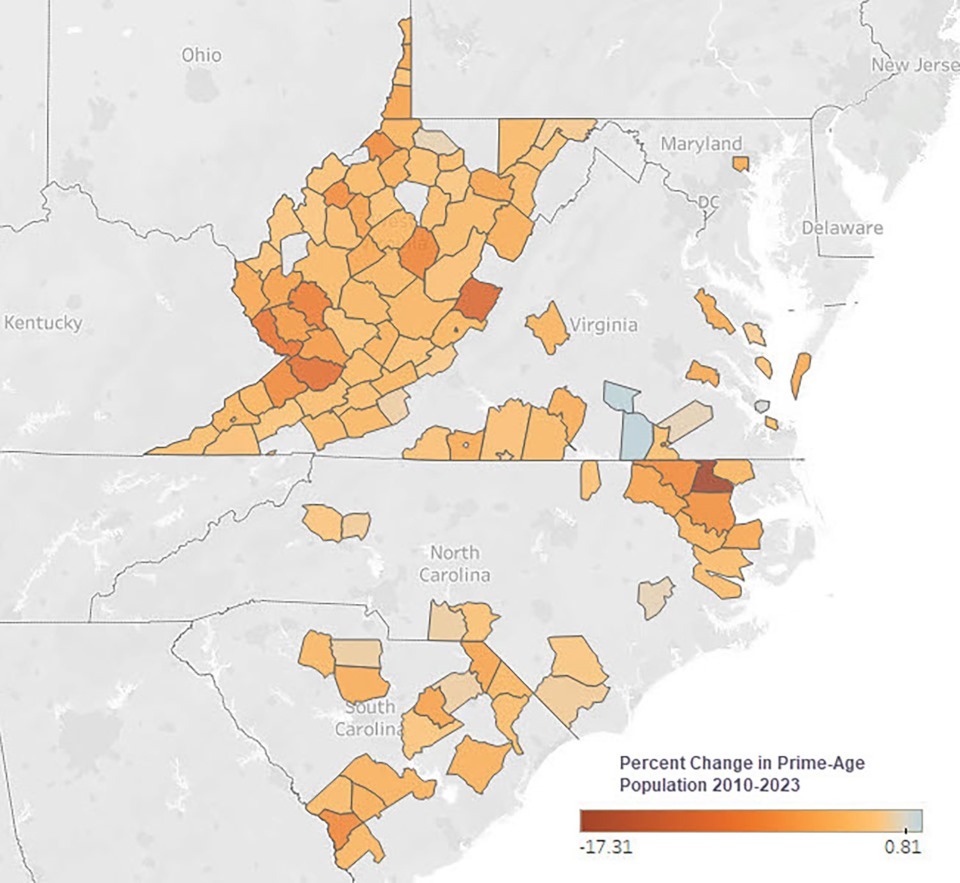
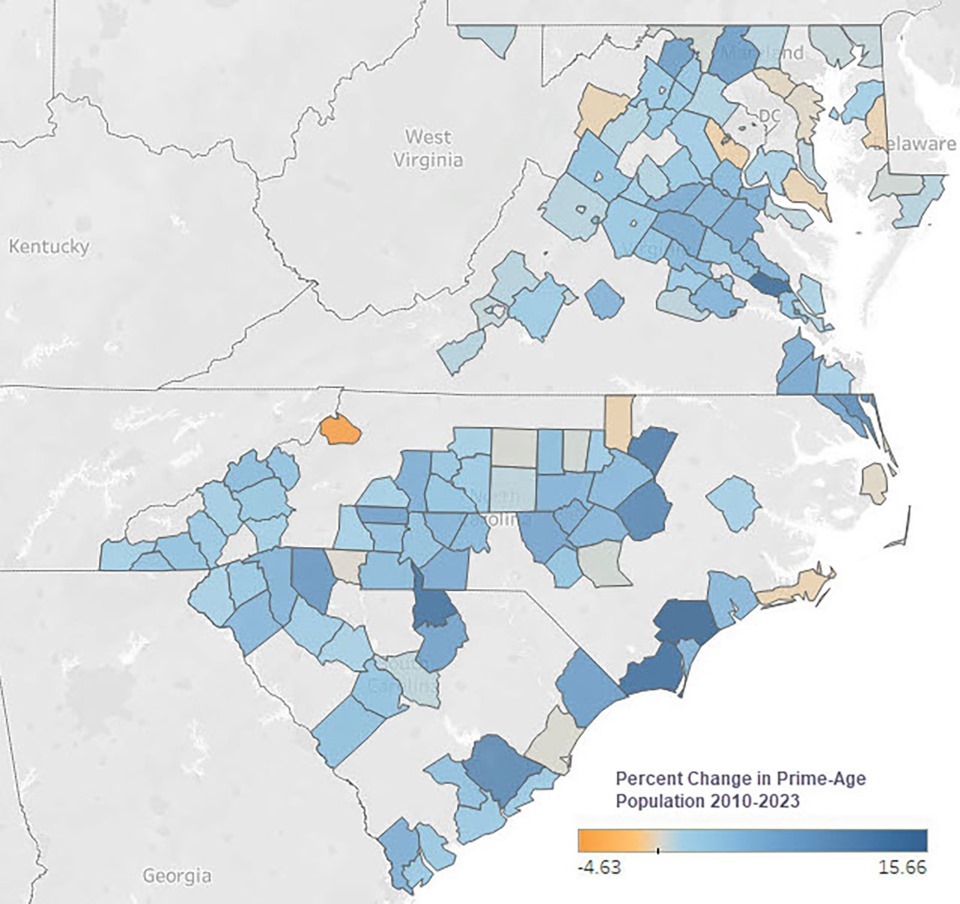
Despite the aging of the population, Richmond Fed research shows that the median age of several rural areas has been falling. This is likely the result of both aging in place and in-migration of younger adults. Unfortunately, the data do not show the ages of in-migrants, requiring researchers to look at growth in population groups. Nearly all counties that gained population saw growth in prime working-age adults.
Having more working-age adults increases the available labor supply, which is something that new businesses consider when choosing a location. Just as an outflow of working-age adults can contribute to a vicious cycle in which employers also leave and drive further population loss, growth in the share of this age group can fuel a virtuous cycle that attracts more employers and more residents.
There is also significant overlap in the age ranges considered prime working age and prime fertility age. Growth in prime fertility-age adults increases "population momentum," as these adults are the most likely to have children and grow the population naturally.
We see this correlation between prime working-age adults and longer-term population growth in the regional data. Nearly all Fifth District counties that lost population from 2010 to 2023 saw a decline in prime working-age adults (ages 25 to 54). Conversely, nearly all counties that grew in that period saw growth in prime working-age adults. (See maps). On average, this age group accounted for 36 percent of each county's total population in 2023.
Studies have shown that this growth in prime working-age adults is, at least to some extent, the result of in-migration. A 2024 article by Hamilton Lombard of the University of Virginia's Weldon Cooper Center for Public Service showed that since 2020, younger adults have been moving out of urban areas to smaller towns and rural areas and bringing higher incomes with them. "Small towns and rural areas have been attracting younger adults at the highest rate in nearly a century," Lombard wrote. And this is happening at a time when fewer people are moving overall.
Additionally, a 2024 article by Alan Berube of the Brookings Institution found that remote or hybrid working arrangements were likely behind the move of younger adults to rural areas where housing is available and affordable. He also noted that growth seemed to be concentrated in areas that were near a metro area.
Geographic Features of Growing Rural Counties
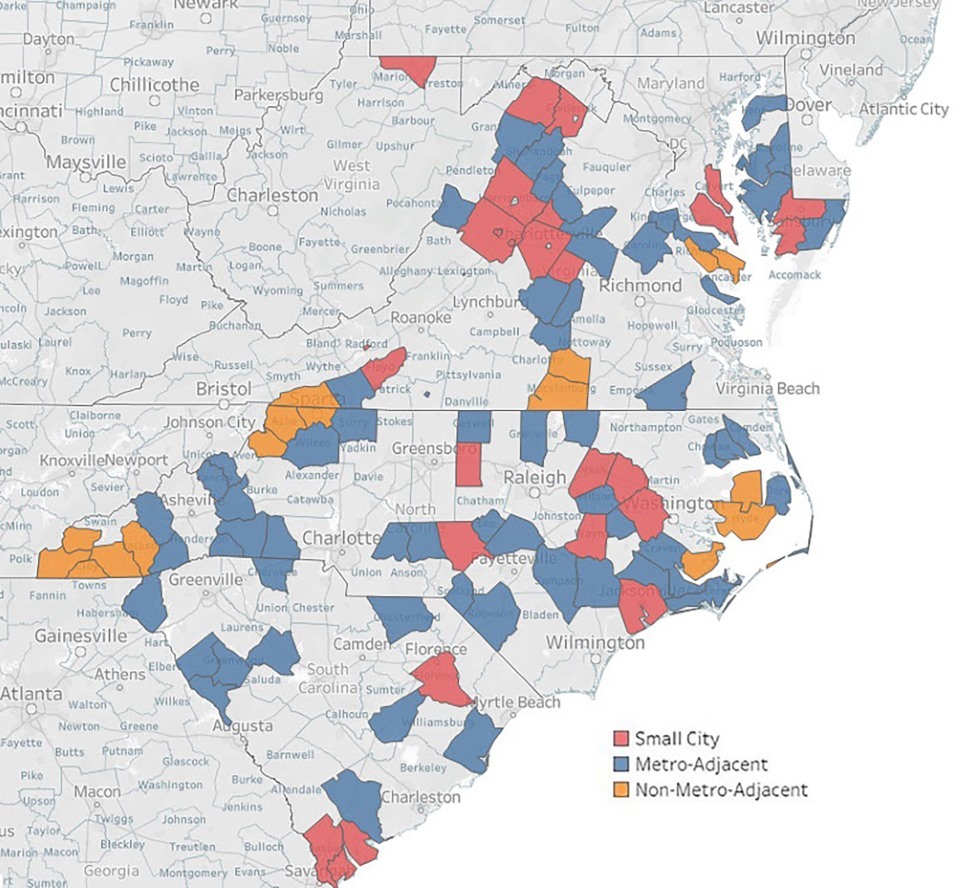
Berube's finding that population growth has been concentrated in metro areas and in smaller cities holds true for the Fifth District. Among the 107 rural counties that had population growth between 2020 and 2023, the vast majority (85 percent) are connected to a metropolitan area in some way. Twenty-six of them have an RUCC of 3, which is defined as a small city. And 65 counties are considered metro-adjacent, meaning that at least one border touches a county that is part of a Metropolitan Statistical Area, or MSA. These are counties with an RUCC of 4, 6, or 8. (See map.)
Proximity to a metro area does not guarantee growth, however. For example, while most of the exurbs around Raleigh, N.C., are growing, Vance County, to the northeast of the city, saw its population decline between 2010 and 2023. Similar examples can also be found around other metro areas.
The availability of more affordable housing compared to the nearby cities may explain some of the growth in these adjacent counties. The median home prices in counties adjacent to a metro area are typically lower than the median price in the metro area that they border. For example, in Raleigh, the median home price within the MSA (according to the Census' 2023 American Community Survey) was around $440,000, while the median prices in neighboring Nash and Wilson counties were around $211,000 and $212,000, respectively.
The ability of rural counties to grow might depend on their ability to build housing. Here, topography plays a role. Generally, flatter land is more conducive to building houses. A 2020 report by the Center for Real Estate at Portland State University estimated that building a home on moderate to steeply sloped land increased the overall cost of a house by a range of 6 percent to 37 percent.
In the Fifth District, counties with land considered to be plains are more likely to be growing. Using the natural amenity data provided by the U.S. Department of Agriculture, which categorizes land type at the county level and identifies counties as having plains, tablelands, hills, and mountains, about two-thirds of the rural counties that are considered plains have experienced population growth in recent years. Meanwhile, counties with a lot of hills are most likely to be losing population. There are no counties in the Fifth District considered tablelands. (See table.)
| Type of Land Formation | Growth | Decline |
|---|---|---|
| Hills | 2 | 25 |
| Mountains | 37 | 49 |
| Plains | 68 | 35 |
| Source: U.S. Census Bureau and U.S. Department of Agriculture | ||
While plains tend to be growing and hilly areas tend to be shrinking, counties that are mountainous are more evenly split. In the Fifth District, these counties are all in Appalachia. Mountainous land might be more difficult to build housing on, but it is also a natural amenity that can offer desirable features, such as good views and privacy. This could be part of the reason why some mountainous counties are experiencing population growth.
Other natural amenities that provide opportunities for outdoor recreation, such as bodies of water like lakes, rivers, and oceans, could also be attracting new residents. (See "Investing in the Great Outdoors," Econ Focus, First/Second Quarter 2024.) The data from the U.S. Department of Agriculture also include a measure for how much of a county's land area is water. Most of the rural counties in the Fifth District are less than 10 percent water, but among the 27 counties with more than 10 percent, most of them (22 out of 27) are growing in population.
Nearly all of these 27 counties are coastal, stretching from the Eastern Shore of Maryland to South Carolina. Almost every rural county that touches the Atlantic Ocean has seen population growth in recent years, indicating that proximity to the ocean or bay is a desirable amenity.
Yet for all these geographic commonalities among growing rural areas, there are exceptions. Not every county that is connected to a metro area is growing. Likewise, flat land, scenic mountains, and other natural amenities do not guarantee growth. Some places have managed to grow without any of these features.
Where Else Is Growth Happening?
As the previous map showed, there are some clusters of growing counties in the Fifth District that are not metro-adjacent or along the coast. Several of those are in the mountainous regions of southwest Virginia and southwest North Carolina, where natural beauty can be a draw for retirees and workers alike. In fact, most of these counties are seeing growth in prime working-age adults. Several of them have been growing for decades, and that growth is now spreading to neighboring counties.
For example, in southwest North Carolina, there are five growing counties that are not metro-adjacent. Four of them (Cherokee, Clay, Macon, and Jackson) have been growing for decades and have recently seen growth in their prime working-age populations. Some of that growth is likely due to increased remote working opportunities. According to a 2025 report from North Carolina Association of County Commissioners, the share of workers reporting working remotely has risen in each of the four counties between 2020 and 2023. In Clay County, that share nearly doubled from 4.3 percent to 7.5 percent.
Another cluster of growing non-metro-adjacent counties is in southern Virginia, where Mecklenburg and Lunenburg counties have seen population growth in recent years after declining in several previous decades. Mecklenburg County benefits from having a large body of water, but it was also the site of a large data center built in 2010, which provided revenue that the county used to renovate its public schools. Additionally, in 2017, VCU Health opened a new hospital in the county, leading to employment growth in the education and health services sector.
Where Is Growth Not Happening?
While many places have seen population growth in recent years, there are 87 counties in the Fifth District that have experienced population decline for three or more decades. The vast majority of these (74 out of 87) are rural counties. Many of these counties have continued to shed population in the last few years, too.
While there are shrinking counties in each state in the Fifth District, almost half of them are in West Virginia. The state's population has declined in most decades since it reached a peak of just over 2 million residents in 1950. The decline in population since 1950 has coincided with a turning point in coal employment, which was around 120,000 in 1950, fell by more than half by 1960, and continued to decline for the next several decades.
Our Related Research
"Shifting Rurality: Is It Possible to Increase Population and Become More Rural?" Regional Matters, April 11, 2024
"Why is Geographic Mobility Declining," Economic Brief No. 25-19, May 2025
"Growing Younger: Are Rural Demographics Shifting?" Regional Matters, May 22, 2025
In a 1999 paper, Brian Lego of West Virginia University looked at population growth throughout the 20th century and discussed how coal, and the broader energy sector, has impacted population growth at various periods of time. For example, the need for energy production in the 1970s led to a period of population growth, and changes in the energy market led to a subsequent decline. Population losses have been most prominent in the coal mining regions of the state.
Lego also showed how the state's demographic makeup changed dramatically over the century, going from having one of the youngest median ages in the country to having one of the oldest, as many of the working-age residents migrated out of the state after the coal industry's decline. The trend of out-migration from the state has persisted since 2000, and with an older population, the state's population has also been declining from natural change (more deaths than births).
Negative natural change is also common among counties outside of West Virginia that have been shrinking in recent years: Nearly every county in the Fifth District that lost population between 2020 and 2023 experienced negative natural changes. About half of them also have domestic out-migration, and those that have seen domestic in-migration have largely been growing in their age 55 and older population.
No Magic Formula
What lessons can be drawn from rural counties that have grown continuously over the last half century or have reversed population loss experienced in the 2010s? As discussed, many of the rural areas that are growing are near metro areas. The rise in remote and hybrid work since the pandemic may have allowed prime-age adults to move farther from urban offices. Many of these growing exurbs have land that is suitable for building houses, and average home prices tend to be lower than in neighboring urban counties, positioning them to absorb this in-migration of workers.
Many also have natural amenities, such as mountains, lakes, rivers, and beaches, which can be a draw for both retirees and working-age adults. Sometimes it's a new employer coming to town or one leaving that can drive population growth one way or the other.
But for all of these factors, there are exceptions. There is no magic formula for guaranteeing population growth. In some cases, the secret to success may be an unmeasurable characteristic that isn't captured in the data. Some growing rural areas might have a strong sense of place that draws people in, or a strong desire by local leaders and the political will to invest in projects that can foster growth, such as housing development, transportation systems, or broadband infrastructure.
In addition, some of the growing metro-adjacent rural counties of today may become the urban counties of tomorrow. Every 10 years, the RUCCs for each county are updated. As people move to the suburbs and surrounding counties and commute into the city for work, those areas that were once rural can become part of the metropolitan area. Of course, the reverse is also possible. If an outlying county of an urban area shrinks in population and fewer people commute to the city for work, it can be reclassified as rural.
Sometimes those changes can be quite drastic. In the 2023 RUCC update, Camden County, N.C., went from a designation of 8 (a very small metro-adjacent county) to 1 (a very urban county) because it became part of the Virginia Beach MSA. In contrast, Lincoln County, W.Va., went from 2 to 8, as it was no longer deemed part of the Huntington MSA. In addition to these classification changes, as the boundaries of metro areas change, the composition of metro-adjacent counties also shifts. If more growing rural areas get redefined as urban, it could perpetuate the story of urban growth and rural depopulation.
Subscribe to Econ Focus
Receive an email notification when Econ Focus is posted online.
By submitting this form you agree to the Bank's Terms & Conditions and Privacy Notice.
Contact Us