Predicting Recessions
This Economic Brief evaluates the predictive capabilities of the yield curve and several other leading indicators, including the Conference Board Leading Economic Index (LEI), claims for unemployment insurance, manufacturing activity, consumer lending, and CEO optimism. According to in-sample statistical analysis, several indicators — particularly the three-month/ten-year term spread and the LEI — have demonstrated significant value in predicting recessions during the past sixty years.
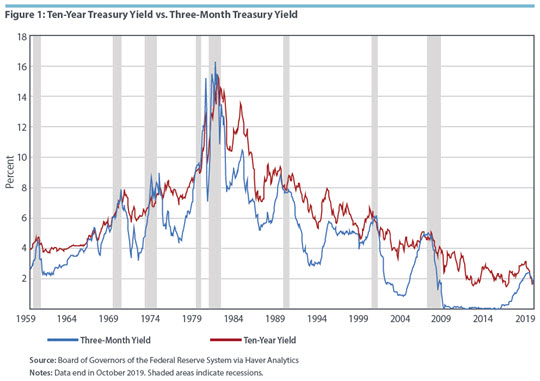
The current cyclical expansion in the United States has lasted more than ten years, the longest on record. Although the duration of the expansion alone is not necessarily evidence that a recession is becoming more likely,1 speculation has increased that a downturn is coming. This has been heightened by low rates on longer-term U.S. Treasury securities relative to shorter-term securities; in mid-2019, for example, the yield on ten-year notes actually dipped below the yield on three-month bills. Such an "inversion" of the yield curve typically has preceded recessions. (See Figure 1 below.) This Economic Brief evaluates the predictive capabilities of the yield curve and several other indicators, including the Conference Board Leading Economic Index (LEI), claims for unemployment insurance, manufacturing activity, consumer lending, and CEO optimism.
A challenge for this analysis is that there have been only eight recessions over the past sixty years. As a result, a small number of observations determines the relative performance of the various predictor variables. In addition, the analysis uses reduced-form regressions, raising the possibility that the regression coefficients are unstable. (See the box below for details on the regression analysis. Full results are available from the authors.) Accordingly, the goal of this brief is not to assert with certainty that any one indicator (or combination of indicators) can always predict recessions, but rather to identify variables worth following for real-time analysis of economic conditions.
Regression Analysis Details
Several variables were examined for their ability to predict recessions. A binary variable, the recession indicator, was constructed, taking a value of 1 in month t if that month is in a recession, as defined by the National Bureau of Economic Research, and 0 otherwise. In this analysis, the recession indicator has a lead of three to twelve months relative to the independent variable. Logit regressions were used to estimate recession probabilities, with the dependent variable being the recession indicator. Several other variables were evaluated as independent variables. Regressions were estimated by maximum likelihood. Pseudo-R2 and t statistics were calculated. Since the dependent variable leads the independent variable, the fitted values can be interpreted as probabilistic forecasts. Other statistics from the regressions also were used to evaluate the independent variables.
Term Spreads
A plot of interest rates by maturity is referred to as a yield curve, and the difference between a longer-term yield and a shorter-term yield is called a term spread.2 In general, investors expect long-term rates to be higher than short-term rates because longer-term investments are subject to greater risk. When long-term rates are below short-term rates, the yield curve is said to be inverted. A large body of economic research has found that yield-curve inversions are associated with — and can predict — recessions.3 As Luca Benzoni, Olena Chyruk, and David Kelley explain in a 2018 Chicago Fed Letter, this relationship could arise through the interplay of monetary policy and market participants’ expectations.4 The interest rate on a long-term bond reflects investors' beliefs about the path of short-term interest rates. If market participants expect the Federal Open Market Committee (FOMC) to lower interest rates in the future, for example in response to slowing economic activity, this would lead to lower long-term rates. Conversely, market participants might expect the FOMC to raise interest rates in response to rising inflation; this would both increase short-term rates relative to long-term rates and increase the odds of a future contraction.
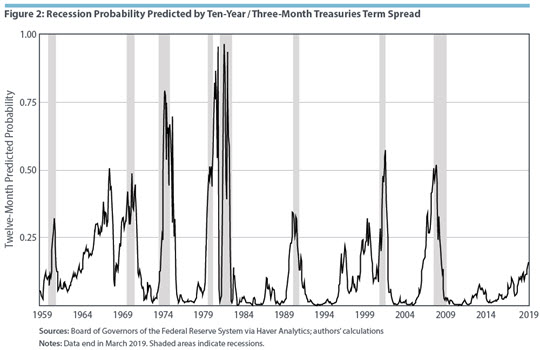
This brief analyzes the forecasting performance of three term spreads that have been discussed in the literature: three-month and ten-year Treasuries, three-month and five-year Treasuries, and two-year and ten-year Treasuries. Consistent with previous research, each term spread is a significant predictor of recessions in most regressions over horizons ranging from three months to twelve months. Figure 2 below displays the fitted probability at the twelve-month horizon of a recession based on the three-month/ten-year spread. There are well-defined peaks in probability at recessions and only a few false positive signals, defined as time periods in which the fitted probability of recession exceeds 50 percent in the absence of a nearby recession. (Graphs for the three-month/five-year spread and two-year/ten-year spread are not displayed because the results are similar to the three-month/ten-year results.)
It is important to note, however, that while yield-curve inversions are associated with recessions, they do not cause recessions. Thus, if underlying economic conditions change, so can the meaning of the signal given by a yield curve inversion. One particular change, discussed in a 2018 Economic Brief, is that "term premiums" are now much lower than in earlier decades.5 A long-term interest rate can be divided into two components. One is the path of expected short-term rates, and the other is the remainder, which is referred to as the term premium. The authors point out that an estimate of the term premium in ten-year Treasury rates fell from over 4 percent in 1985 to less than zero in 2018. They also note that a lower term premium makes it more likely that the yield curve will invert. Consequently, the signal sent by a yield-curve inversion today may differ from the signal sent by a similar yield-curve inversion in the past.
Leading Indicators
The formal study of "leading indicators" dates back to the 1930s and 1940s, when a group of prominent economists associated with the National Bureau of Economic Research worked to identify cyclical indicators that could signal upturns and downturns in the U.S. economy.6 The Census Bureau began publishing monthly reports on business cycle indicators in the 1960s, and in 1972 the indicators program moved to the Bureau of Economic Analysis (BEA). When the BEA stopped publishing business cycle indicators in 1995, the Conference Board, a nonprofit research group, continued the program.7
Today, the Conference Board constructs its LEI using ten indicators: average weekly hours worked in manufacturing, average weekly initial claims for unemployment insurance, new orders for manufactured consumer goods and materials, new orders for manufactured nondefense capital goods excluding aircraft, the Institute for Supply Management’s (ISM) index of new orders for manufacturing, building permits for new housing units, the S&P 500 stock price index, the ten-year Treasury yield minus the federal funds rate, composite consumer expectations from the Conference Board and University of Michigan surveys, and a leading credit index of six financial variables intended to anticipate cyclical turning points.8
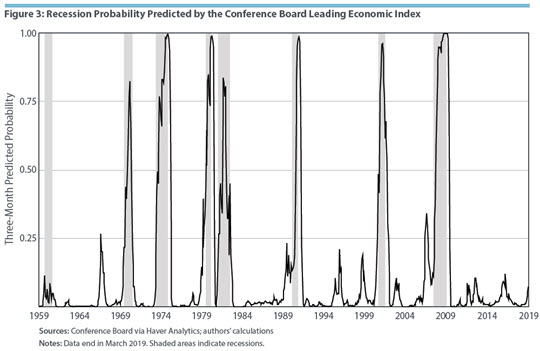
Like the yield curve, the LEI performed well in the regression analysis. The estimated coefficient for the index was significant at each time horizon. As shown in Figure 3 below, there are well-defined peaks in probability within three months of a recession, except for the 1960 recession, and no false positive signals. One difference is that the LEI did relatively better at the shortest horizon, while the yield curve did relatively better at the longest horizon.
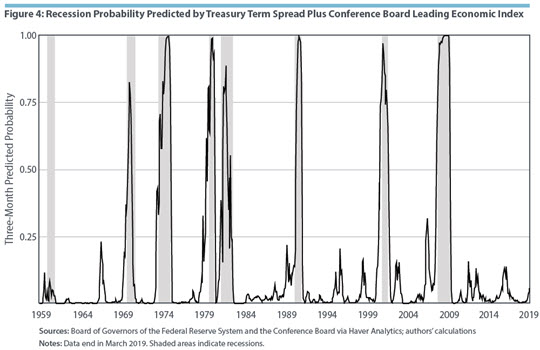
Combining the LEI with the three-month/ten-year term spread improves predictive ability relative to either indicator by itself. The fitted projections have well-defined spikes at all recessions and no false positive signals. (See Figure 4 below.)
Other Indicators
The statistical analysis also considered four other individual series that have been discussed as cyclical indicators: new claims for unemployment insurance, which provide a gauge of employment separations; the ISM's index of new orders in manufacturing; a diffusion index measuring banks' willingness to make consumer installment loans (from the Federal Reserve's Senior Loan Officer Opinion Survey); and the Conference Board Measure of CEO Confidence. (The first two indicators also are included in the LEI.)
The weakest predictor of recessions was new claims for unemployment insurance. The results for the other three indicators were similar: each regression had significant coefficients for the independent variable. They also all had well-defined spikes in probability around recessions, and mostly avoided false positive signals.
Conclusion
Several macroeconomic series, particularly the three-month/ten-year term spread and the LEI, have significant value in predicting recessions, according to in-sample regression analysis. In addition, the combination of these two variables was more accurate than either variable by itself.9 It will be interesting to track the post-sample results to see if they add value in predicting or even simply recognizing the next recession. In addition, further work on combining indicators could prove useful. Finally, a deeper understanding of the value of estimated recession probabilities for various users could help develop better recession indicators.
Matthew Murphy is a research associate, Jessie Romero is director of research publications, and Roy Webb is a senior economist and policy advisor in the Research Department at the Federal Reserve Bank of Richmond.
For example, see Francis X. Diebold, Glenn D. Rudebusch, and Daniel E. Sichel, "Further Evidence on Business-Cycle Duration Dependence," in Business Cycles, Indicators, and Forecasting, edited by James H. Stock and Mark W. Watson, University of Chicago Press, 1993, pp. 255–284.
The discussion in this section will be confined to yields on U.S. Treasury securities.
See Arturo Estrella and Frederic S. Mishkin, "Predicting U.S. Recessions: Financial Variables as Leading Indicators," Review of Economics and Statistics, February 1998, vol. 80, no. 1, pp. 45–61; also see Campbell R. Harvey, "Term Structure Forecasts Economic Growth," Financial Analysts Journal, May/June 1993, vol. 49, no. 3, pp. 6–8.
Luca Benzoni, Olena Chyruk, and David Kelley, "Why Does the Yield-Curve Slope Predict Recessions?" Chicago Fed Letter No. 404, 2018.
Renee Haltom, Elaine Wissuchek, and Alexander L. Wolman, "Have Yield Curve Inversions Become More Likely?" Federal Reserve Bank of Richmond Economic Brief No. 18-12, December 2018.
Kajal Lahiri and Geoffrey H. Moore, "Introduction: The Leading Indicator Approach," in Leading Economic Indicators: New Approaches and Forecasting Records, edited by Kajal Lahiri and Geoffrey H. Moore, Cambridge University Press, 1991, pp. 1–4.
The Conference Board, Business Cycle Indicators Handbook.
The composite leading index is constructed to generally increase over time. To remove the time trend, this brief examines the six-month change in the index.
David Kelley recently reached similar conclusions in "Which Leading Indicators Have Done Better at Signaling Past Recessions?" Chicago Fed Letter No. 425, 2019. His analysis differs in statistical methodology, but he also found that the LEI worked well at shorter horizons, the term spread worked especially well at longer horizons, and there was additional value in combining indicators.
This article may be photocopied or reprinted in its entirety. Please credit the authors, source, and the Federal Reserve Bank of Richmond and include the italicized statement below.
Views expressed in this article are those of the authors and not necessarily those of the Federal Reserve Bank of Richmond or the Federal Reserve System.
Receive a notification when Economic Brief is posted online.


