Fed Balance Sheet Normalization and the Minimum Level of Ample Reserves
Economic Brief
February 2023, No. 23-07
The normalization process of the Fed's balance sheet is ongoing. Current plans for monetary policy implementation interact with this process. In particular, normalization is aimed at ultimately providing a minimum level of "ample" reserves. The timing for when that level of reserves will be reached depends on multiple factors. Based on assumptions reflecting current expectations of the evolution of those factors in the medium term, normalization will be completed by late 2025 or early 2026.
The size and composition of the Federal Reserve's balance sheet is a critical consideration in designing an effective approach to monetary policy implementation. The Fed has stated that, in the longer run, it intends to provide the minimum level of reserves consistent with being considered abundant or "ample." From the beginning of the pandemic through the spring of 2022, the Fed's balance sheet increased significantly due to the Fed's efforts to aid market functioning and support the flow of credit to households and businesses. Reserves in the banking system increased to record highs, well beyond levels desired by the Fed in the long run.
With financial and economic conditions improving, the Fed started the process of balance sheet normalization in March 2022, whereby it intends to significantly reduce the amount of Treasuries and mortgage-backed securities (MBS) that it holds in its System Open Market Account (SOMA) portfolio.
As this process continues, a critical question is: How much further can the balance sheet be reduced? In its Balance Sheet Normalization Principles and Plans, the Fed expressed its desire to have a balance sheet consistent with a "floor system" for monetary policy implementation.1 In this article, we provide an estimate of the level of reserves that the Fed might consider appropriate given those plans as well as an estimate of the date that such level might be reached, given current Fed-set parameters for the normalization process.
Ample Reserves
Ample reserves are a critical component in a floor system. The idea is for the Fed to maintain a balance sheet large enough to accommodate growth in currency in circulation plus an ample quantity of bank reserves. "Ample" means that reserves are plentiful enough to not carry any significant convenience yield. In other words, banks should value the marginal unit of reserves for the interest on reserves that they earn, but not because that marginal unit facilitates the daily operations of the bank holding it in any meaningful way. When this is the case, the interest rate in most interbank transactions will remain very close (and often equal) to the interest on reserves.
This is important because policymakers decide the level of the interest on reserves, which is fixed at an administered rate. As a result, when reserves are ample, the Fed is able to target and (tightly) control its desired level of short-term interest rates in the market by moving the interest paid on reserves (which can be precisely adjusted by fiat). Fluctuations in these rates impact different portions of the economy, from general asset markets to specific consumer credit such as car and credit card loans. Interest rate targeting is the approach the Fed uses to achieve its objectives of full employment and price stability, as mandated by Congress.
In its "Balance Sheet Normalization Principles and Plans," the Fed has also pledged that "the SOMA portfolio will hold no more securities than necessary for efficient and effective policy implementation." On the liability side of the Fed's balance sheet, this amounts to targeting a minimum level of ample level of reserves.
There are several possible reasons to target a minimum, a critical one being improved interest rate control: Most banks active in the U.S. are heavily regulated and face significant capital requirements. For this reason, when the Fed's balance sheet is very large and banks hold large quantities of reserves on their balance sheets, those holdings carry an additional and sometimes significant balance sheet cost. This added cost can push interbank rates below interest on reserves, as noted for example in the 2017 paper "Excess Reserves and Monetary Policy Implementation." To achieve good interest-rate control, the Fed needs to strike the right balance between possible balance sheet costs and any convenience yield on reserves remaining in the market. Doing this requires that the Fed provides a level of reserves that is ample but not too large: in short, a minimum level consistent with ample reserves.
Elements for Projecting Bank Reserves
How would the Fed know when the quantity of reserves has reached its minimum ample level? This question is not new. In the prior normalization period — between 2015 and 2019 — the Fed faced similar challenges. One approach involved asking individual private banks what their minimum levels would be, then aggregating the answers.
Alternatively, the Fed could wait for market signals suggesting that the minimum level is close to being reached. In fact, around mid-2019, market interest rates started to display increased volatility, and the Fed assessed that the appropriate level of reserves had been basically reached. In this article, we will use that assessment as a guide for what the new minimum level of ample reserves might be.
Because the U.S. economy grows every year and the demand for currency and reserves grows in concert with economic activity, we need to account for such secular growth when estimating the evolution of relevant aggregates going forward. We will use past growth rates in our approximations. While this may provide crude estimates, the calculations are not very sensitive to reasonable departures from our preferred benchmark.
To estimate the evolution of reserves, we need to consider multiple factors:
- The evolution of the minimum level of ample reserves over time
- The speed of decrease in the size of the Fed's balance sheet
- The expected behavior of the components of Fed's total liabilities
With these factors accounted for, we can calculate how the level of reserves is expected to decrease and when it will reach that minimum ample level. We can also estimate when the Fed would stop reducing its balance sheet and move to a new phase of secular growth that accommodates the higher demand for currency and reserves as the economy grows.
Step 1: Approximating the Minimum Level of Ample Reserves
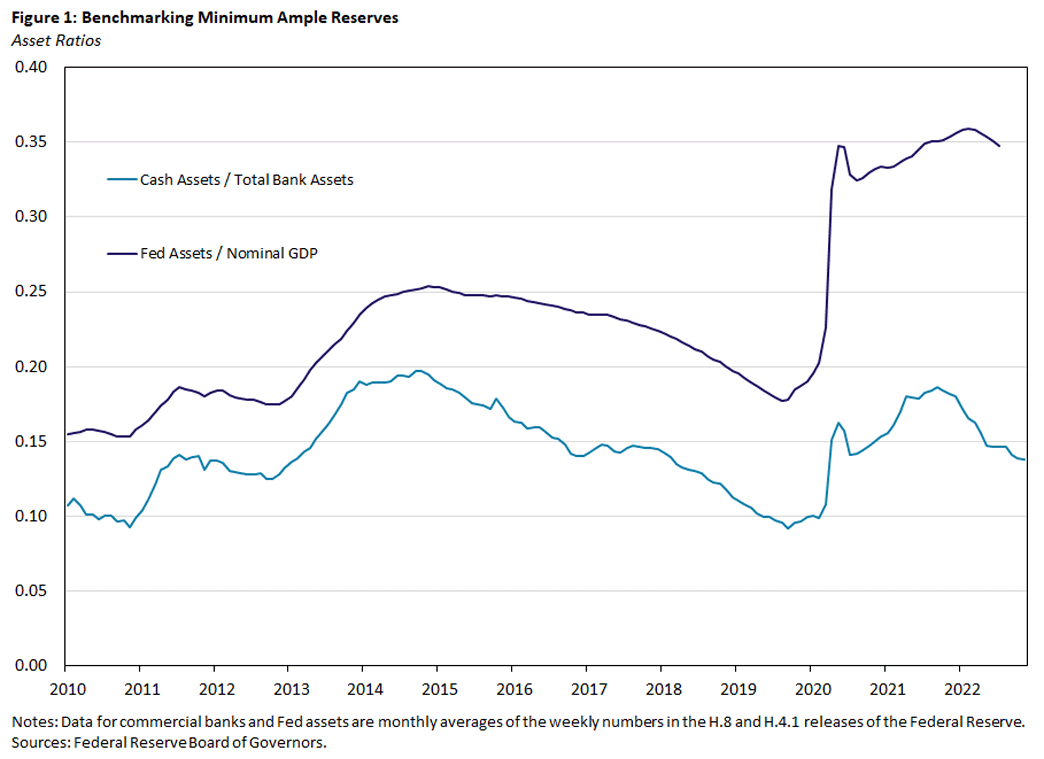
To estimate this critical level of reserves, we begin by looking at the proportion of reserves to bank assets in mid-2019, arguably a time when reserves became close to the minimum level consistent with a floor system. At the time, the ratio of reserves to total commercial bank assets was 0.09, as seen in Figure 1 below.
Given this proportion, we use growth rates observed between 2010 and 2019 to extrapolate future values of banking assets. Growth rates of bank assets are fairly stable during that period. We do not include the pandemic period because we consider the behavior of banking aggregates highly unusual during the pandemic and unlikely to be informative of behavior going forward.
An important aspect of this estimation is how the demand for reserves across different groups of banks (with different motivations) will behave as the level of available reserves falls. For example, some banks — including most U.S. affiliates of foreign banks — are active in what is often referred to as "interest-on-reserve (IOR) arbitrage." Basically, partly because of differential regulatory treatment, these banks incur lower balance sheet costs when holding reserves. Hence, they tend to seek the excess reserves in the system and earn IOR overnight.
As the level of total reserves decreases, though, this kind of arbitrage will likely become less prevalent. Presumably, the amount of IOR arbitrage in the system in August 2019 is comparable to what we might see in the future as we approach the new level of minimum ample reserves. Using the growth on the level of assets for all commercial banks as a guide to estimate the future minimum level of reserves is a way to account for these considerations.
More broadly, these calculations represent only a rough estimate. Other factors could play a role. For instance, depository institutions besides commercial banks hold reserves. Also, the banking industry is constantly evolving, and that evolution may drive certain composition effects that could change these calculations in the margin.
Additionally, the Fed introduced the Standing Repo Facility (SRF) in 2021. By making cash liquidity more readily available to banks, this new facility may help reduce the level of reserves that banks consider minimum ample. It may take some time, however, until most banks get comfortable with potentially using the SRF, and there is significant uncertainty about the magnitude of its effect over the demand for reserves. For this reason, our benchmark calculations do not factor in the SRF.
Similarly, the spread between IOR and the interest rate offered at the discount window is currently lower than it was in 2019. When discount window credit is less expensive, banks may decide to hold lower reserve levels for precautionary reasons. Also, banks with more reserves need less discount window borrowing in general. Since discount window is more affordable now, the demand for reserves may be lower now than in 2019.
Finally, a further potential limitation of using August 2019 for approximating the minimum level of ample reserves is that the current stance of monetary policy is much different than it was then. Liquidity in the Treasury market and other short-term funding markets has been impacted by rate volatility, and demand for cash liquidity is also likely to reflect these changed conditions.2 (The 2022 article "Thin Liquidity Complicates Fed Plans to Tighten" provides additional commentary on this factor.)
Some experts have instead looked at the size of the Fed's balance sheet as a proportion of total nominal GDP around critical times as an alternative for approximating the minimum level of Fed liabilities consistent with ample reserves. Figure 1 above also plots this ratio. In August 2019, the Fed's balance sheet was 18 percent of total nominal U.S. GDP. We will include a calculation using this alternative measure below, mainly for comparison with our benchmark.
Step 2: Gauging the Speed of Fed Asset Rundowns
The Fed's SOMA asset portfolio is allocated mainly to Treasuries and MBS. The Fed intends to reduce the size of the SOMA portfolio primarily by limiting the reinvestment of principal payments it receives from the securities in its portfolio. The Fed has imposed caps on the speed at which it runs down its holdings of Treasuries and MBS. If principal payments are higher than the caps, the Fed will reinvest the amounts in excess of the cap. For Treasuries, the cap is set at $60 billion and is expected to be consistently binding. The cap for MBS rundowns, on the other hand, is set at $35 billion, is currently not binding and is not expected to be binding going forward. This, in turn, creates some uncertainty about the speed of balance sheet reduction.3
Since the expected paydowns of MBS have been consistently around $20 billion, we estimate a monthly decrease in asset holdings of $80 billion, until the balance sheet approaches its minimal level.
Step 3: Estimating the Evolution of the Composition of the Fed's Balance Sheet
The main components of the liability side of the Fed's balance sheet are:
- Currency in circulation (CC)
- Bank reserves (R)
- Overnight reverse repo (ON RRP)
- Foreign repo pool (F RRP)
- Treasury general account (TGA)
- Other deposits
- Capital (and other liabilities)
In "Other Deposits," we include deposits with Reserve Banks other than reserve balances and the TGA. This includes term deposits and deposits by foreign officials, multilateral organizations, government-sponsored enterprises and financial market utilities.
Currency in circulation has grown relatively consistently, and we will approximate its future evolution by extrapolating its growth rate in the relatively calm period between 2010 and 2019. We discuss in detail below how we approach estimating the evolution of the ON RRP and the TGA.
For the other components, it is hard to know how they will evolve, and there are no obvious reasons to believe they will increase or decrease going forward. Fortunately, they are a relatively small portion of the Fed's liabilities. With this in mind, we proceed by keeping them at their current levels for our calculations. In the robustness section below, we provide alternative cases to give a sense of the sensitivity of the results to these benchmark assumptions.
Modeling the ON RRP
Estimating the long-run evolution of balances in the ON RRP is difficult. Basic theory suggests that as reserves become scarcer and the spread between the ON RRP rate and the effective fed funds rate increases, total balances invested at the ON RRP will drift down from its current level of $2.5 trillion.
Balances in the ON RRP function as an alternative to cash. As interest rates increase, other cash alternatives may develop that pay positive interest while maintaining maximal liquidity. The spread between the administered rate at the ON RRP and other relevant short-term interest rates (including IOR) is a key factor driving these decisions.
Still, there is uncertainty about the speed at which balances will fall and the minimum level they might reach. The speed is less important here, as normalizing the balance sheet will simply take time. The minimum level is more of an issue for our calculations, since a positive minimum may result in normalization ending sooner.
In this regard, a pertinent question is whether the Fed should accommodate the higher persistent level of ON RRP takeup with a larger minimum balance sheet or instead adjust the spread between the ON RRP rate and IOR to reduce the attractiveness of holding balances at the ON RRP. At this point, it is hard to rule out either of these two approaches.
Dealing With the TGA
The TGA is the Treasury Department's account at the Fed. This is the account the federal government uses to hold cash balances for receiving and making payments. Balances in the TGA were consistently below $0.5 trillion before the pandemic but increased to over $1.5 trillion in 2020. By mid-2021, balances fell but remain elevated relative to the pre-pandemic levels. In late 2022, they fluctuated between $0.5 trillion and $0.7 trillion.
There is, however, considerable uncertainty about the level of the TGA going forward, both in the short run and medium-to-long run. For our benchmark calculations, we set TGA balances at $500 billion for the horizon of the estimation. This is consistent with current TGA levels and with past Treasury communications. Later, in the robustness section, we consider higher TGA balances to provide some sense of the sensitivity of our calculations to this assumption.
The Expected Timing of Balance Sheet Normalization
Figure 2 below presents our benchmark calculations. We see that reserves reach a quantity consistent with the minimum ample level toward the end of 2025. At that point, total Fed assets start growing to accommodate the secular growth in currency in circulation and in reserves, which is a consequence of the secular expected growth of bank assets and the U.S. economy.
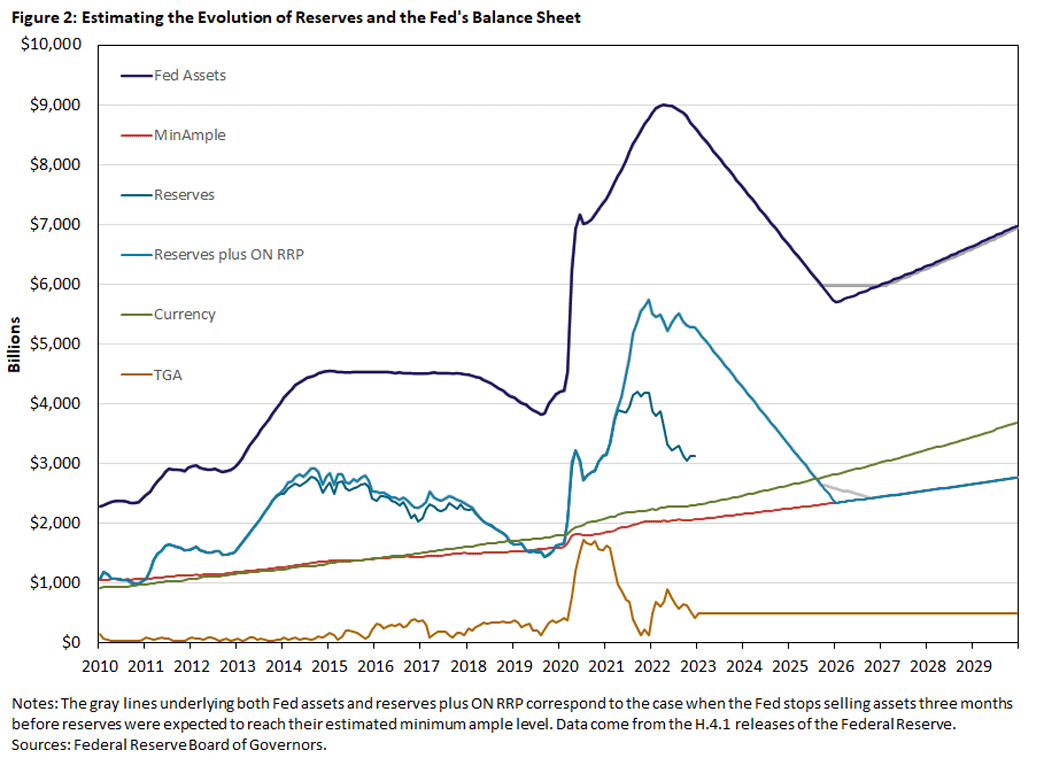
For these calculations, we plot how both reserves by themselves and reserves plus ON RRP have evolved, but we calculated the possible future evolution of only reserves plus ON RRP. Given our interest in understanding when reserves reach their minimum ample level and the presumption that ON RRP will be minimal by that point, no extra information would result from an independent estimation of the evolution of the ON RRP.4
According to its Balance Sheet Normalization Principles and Plans, the Fed will not abruptly shift between decreasing and increasing the size of its balance sheet from one month to the next. Instead, the Fed will first slow down drawdowns, then keep the SOMA portfolio roughly constant for some time and finally transition to a growth phase.
To accommodate this stated approach, Figure 2 above displays an alternative path (in gray) where the Fed stops decreasing the size of its balance sheet three months before reserves were expected to reach the minimum ample level. Note that reserves continue to fall even when the Fed keeps the size of the balance sheet constant. This is because currency in circulation continues to grow and absorb balance sheet "space."
In this alternative calculation, we assume the Fed keeps the size of its balance sheet constant until reserves reach the estimated minimum ample level (the red line in Figure 2 above) and then starts increasing the SOMA portfolio to keep up with trend growth in currency and reserves. When the Fed follows this strategy, halting rundowns three month prior to the benchmark case implies that the Fed will need to wait 11 months (January 2026 to November 2026) for reserves to reach the estimated minimum ample level. This long delay is because the assumed speed of asset drawdown ($80 billion) is much larger than the secular trend growth of currency in circulation.
Interestingly, our benchmark estimates indicate a balance sheet trough of roughly $6 trillion, with reserves reaching a minimum level of $2.3 trillion by late 2025. These projections are consistent with, although perhaps a touch lower than, the median expectation in the December 2022 Survey of Market Participants conducted by the New York Fed.
Sensitivity and Robustness
We made some important assumptions to calculate our benchmark scenario:
Assumption 1 (ON RRP Balances): We assumed that balances invested in the ON RRP will fall to zero by the time the quantity of reserves reaches its minimum ample level. However, it is possible that some balances remain at the ON RRP, as some institutions may value having some investment there for diversification or other reasons.
Assumption 2 (Additional Liabilities): We also have assumed that various components of the Fed's liabilities — the foreign repo pool and other deposits — will stay at their current levels. However, it is possible (and perhaps likely) that balances in those accounts will decrease as reserves in the banking system become scarcer. This is because reserve scarcity is likely to drive up market interest rates (relative to policy-administered rates), and investors will want to shift balances into those more remunerative alternatives.
Assumption 3 (TGA Balances): We assumed that balances at the TGA will remain at $500 billion for the horizon of our calculations. As we mentioned before, there is significant uncertainty about both the medium-term and long-term size of the TGA. For example, in the medium term, events surrounding the modification of the federal debt limit may create significant fluctuations in the size of the TGA (as has happened in the past). At the same time, in the long run, the Treasury may want to maintain higher balances at the TGA for various strategic and administrative reasons.
Assumption 4 (MBS Portfolio Rundown): Finally, we set the speed of rundown for the MBS portfolio at $20 billion per month. However, there is some uncertainty surrounding such a number. Given the general trend to higher interest rates, it seems possible that MBS paydowns may decrease even further. This could slow the MBS rundown process, possibly to only $15 billion a month.
To assess the robustness of our calculations, we modify some of these assumptions and present four alternatives in Table 1 below, together with our benchmark scenario (for comparison):
- In Alternative 1, we consider a situation where the ON RRP decreases to $200 billion and remains at that level.
- In Alternative 2, we allow for the balances in other Fed liabilities to decrease by $200 billion from their current level of approximately $700 billion.
- In Alternative 3, the TGA settles at a higher level than in the benchmark, which we set at $600 billion for concreteness.
- In Alternative 4, we consider the case where MBS paydowns are only $15 billion per month.
In all cases, the table below reports the month and year when bank reserves reach their estimated minimum ample level.
| Table 1: Reaching Minimum Ample Reserves | |
|---|---|
| Scenario | Month and Year Reaching Minimum Ample Reserves |
| Benchmark Scenario | January 2026 |
| Alternative 1: Positive ON RRP balances - $200 billion | November 2025 |
| Alternative 2: Lower other deposits - $200 billion | March 2026 |
| Alternative 3: Higher TGA - $600 billion | December 2025 |
| Alternative 4: Slower MBS paydowns - $15 billion | March 2026 |
We also calculate when the Fed balance sheet (as a percentage of nominal GDP) would reach the level it had in mid-2019 of around 18 percent. For that, we assume a growth rate of nominal GDP of 4 percent, which is (approximately) the average between 2010 and 2019. The Fed balance sheet is assumed to decrease by $80 billion per month until reaching that 18 percent ratio.
We find that it would take until April 2026 for the ratio to reach 2019 levels.5 In other words, using a broader measure (based on the Fed's balance sheet relative to the size of the U.S. economy) than our estimated benchmark measure of minimum ample reserves (based on the expected evolution of the size of the banking system), the normalization process would take approximately three months longer.
Conclusion
Why is estimating these numbers and the timing implied important? If the Fed wants to avoid the possible interest rate volatility that may come with a level of reserves too close to the minimum level acceptable by banks while also announcing any modifications to its balance sheet policy with several months of anticipation, then these estimates provide valuable guidance. Furthermore, these estimates may inform an eventual decision regarding the need to sell securities from the Fed portfolio back to the market before maturity.
Our calculations indicate that, just by allowing the securities to mature, it would take the Fed two to three years to reach a normalized size of its balance sheet. This seems an acceptable time. However, the Fed's Balance Sheet Normalization Principles and Plans expressed the desire to hold primarily Treasuries in the long run. Given the likely slow rundown of MBS, perhaps the main reason to consider asset sales would be to adjust the composition (rather than the total size) of the Fed's balance sheet.
Huberto M. Ennis is an economist and Tre' McMillian is a research associate in the Research Department at the Federal Reserve Bank of Richmond.
1
A "floor system" controls short-term interest rates by supplying ample reserves and paying interest on those reserves at a level close to or equal to the level targeted by monetary policymakers. Further explanation can be found in the 2020 report "Monetary Policy Implementation with an Ample Supply of Reserves."
2
Yet another factor is how the Treasury Department will make decisions about the maturity composition of the newly issued government debt. For example, Treasury bill issuance increasing relative to historic standards could reduce the demand for bank reserves in meaningful ways.
3
For a detailed discussion of the factors driving the level of rundowns and an earlier calculation of the expected levels going forward, see the 2022 article "Projecting the Evolution of the Fed's Balance Sheet."
4
See the 2022 article "The Fed's Balance Sheet Runoff and the ON RRP Facility" for a detailed discussion of the mechanics behind the joint evolution of the different components of the balance sheet as the process of normalization proceeds.
5
If we instead assume that nominal GDP grows at 5 percent annually, then the ratio reaches 18 percent in February 2026.
To cite this Economic Brief, please use the following format: Ennis, Huberto M.; and McMillan, Tre'. (February 2023) "Fed Balance Sheet Normalization and the Minimum Level of Ample Reserves." Federal Reserve Bank of Richmond Economic Brief, No. 23-07.
This article may be photocopied or reprinted in its entirety. Please credit the authors, source, and the Federal Reserve Bank of Richmond and include the italicized statement below.
Views expressed in this article are those of the authors and not necessarily those of the Federal Reserve Bank of Richmond or the Federal Reserve System.
Subscribe to Economic Brief
Receive a notification when Economic Brief is posted online.
Contact Us