Gimme Shelter Inflation
As we discussed last week, much of the rise in inflation over the past two months reflects a recovery in prices that are now making a rapid comeback as demand normalizes. For example, compared to last year, the price index for food services is up 2.9 percent, hotel and motel prices are up 11.9 percent, and motor vehicle rental prices are up an enormous 115 percent. Some other prices, notably autos, have been inflated due to supply chain bottlenecks. Factory closures and semiconductor shortages have contributed to a 3.6 percent year-over-year increase in the price index for new vehicles, with knock-on effects for the used vehicle market where car-hungry customers have driven prices up 37.9 percent year-over-year. Pent-up demand and supply bottlenecks represent temporary sources of inflation that Fed policymakers are looking past as they determine the appropriate stance of monetary policy.
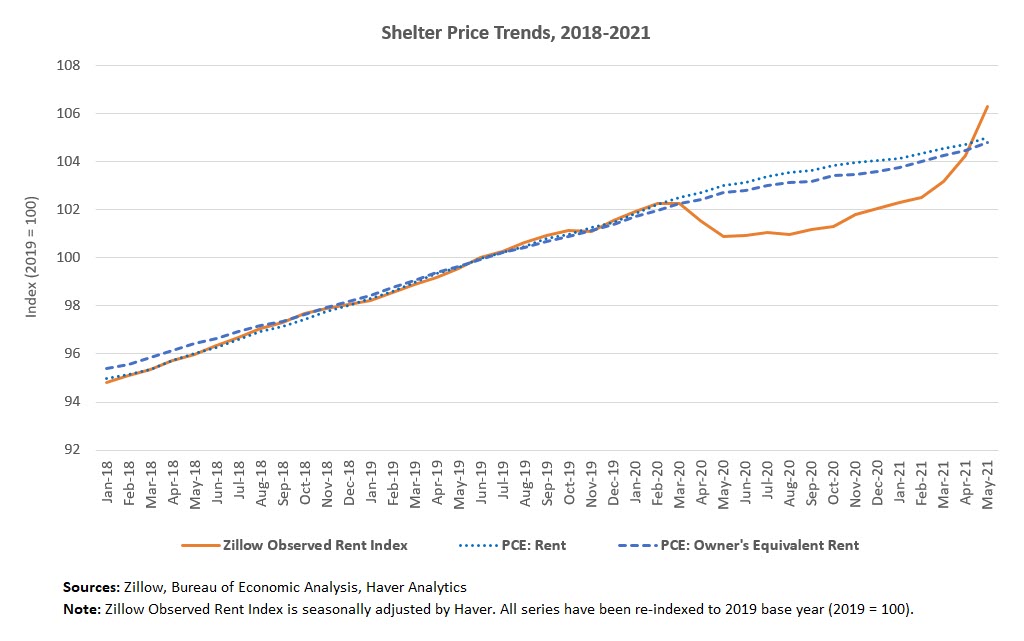
But May's PCE price report also showed an acceleration in the prices people pay for housing, a development which might have more lasting implications for the path of core inflation ahead. Housing services prices rose 0.3 percent on a monthly basis, up from 0.2 percent in April, and are 2 percent higher on an annual basis. Unlike the price indexes for services like rental vehicles and air transportation, the price level of housing services did not fall sharply at the trough of the pandemic, making the recent increases more noteworthy. On a three-month annualized basis, housing services prices have risen 2.9 percent in May, up from 2.7 percent in April and increasing for the fourth straight month.
"... The recent rise in average asking rents suggests landlords are feeling more confident about raising rents as business and consumer activity strengthens over the summer."
Two main features make shelter prices particularly eye-catching in this period of elevated monthly inflation. First is a significant contribution of shelter prices to aggregate inflation: Housing services make up about 16 percent of overall PCE and 18 percent of core PCE. The second feature is that housing services prices appear to be particularly sticky. The two main components of housing services are rent of primary residences and owners' equivalent rent (OER), which refers to the price that homeowners would pay to rent their home in a competitive market, and is imputed from surveys of rental units. Rent prices change infrequently enough that the Bureau of Labor Statistics collects rent data for sample properties every six months rather than monthly or bimonthly as for most other items. And a study by economists at the Cleveland Fed found that one of the best predictors of OER inflation was previous OER inflation — in other words, high OER inflation tends to be followed by high OER inflation.
Because shelter prices are sticky, May's higher prices could be a harbinger of elevated inflation to come. Alternative data also point to further increases ahead. An index of rental appreciation produced by Zillow, an online real estate marketplace, rose 2.3 percent in May — the fastest monthly growth rate in data that begins in 2014 — and now stands above its pre-pandemic trend. The Zillow index measures asking rents, which may not perfectly reflect what renters are currently paying. But the recent rise in average asking rents suggests landlords are feeling more confident about raising rents as business and consumer activity strengthens over the summer. As existing contracts are renegotiated and new leases are signed, this dynamic might eventually pass through to the housing services component of inflation, and it makes shelter prices an area worth watching as market participants try to understand the extent to which recent inflation is transitory or persistent.
Views expressed in this article are those of the author and not necessarily those of the Federal Reserve Bank of Richmond or the Federal Reserve System.


