Watching Services Inflation in 2023
For our first post in 2023, we pick up right where we left off: discussing inflation. The last news we received after the mid-December FOMC meeting came from November PCE inflation. Declines in goods prices helped bring down the overall inflation rate. Prices for goods decreased 0.4 percent, while prices for services rose 0.4 percent. On a year-over-year basis, goods inflation (6.1 percent) is still higher than services inflation (5.2 percent).
With goods inflation and services inflation moving in opposite directions, which measure should we pay more attention to?
Research suggests that services prices may carry more signals for future overall inflation. Specifically, median inflation — or the price change of the component in the middle, after inflation components are ranked according to the size of their monthly price changes — has been found to provide better forecasts of future inflation compared to the headline measure.1 (See the Cleveland Fed's website for more details on median CPI and median PCE.)
The recent paper "Slack and Cyclically Sensitive Inflation" by James Stock and Mark Watson (who is a long-term consultant of the Richmond Fed) mentions that, more often than not, the median component reflects the price of a service. In particular, "the median CPI is a housing price inflation measure in nearly 57% of months, and in another 17% of months the median CPI is either ... food services, or recreation, which is mainly recreational services."
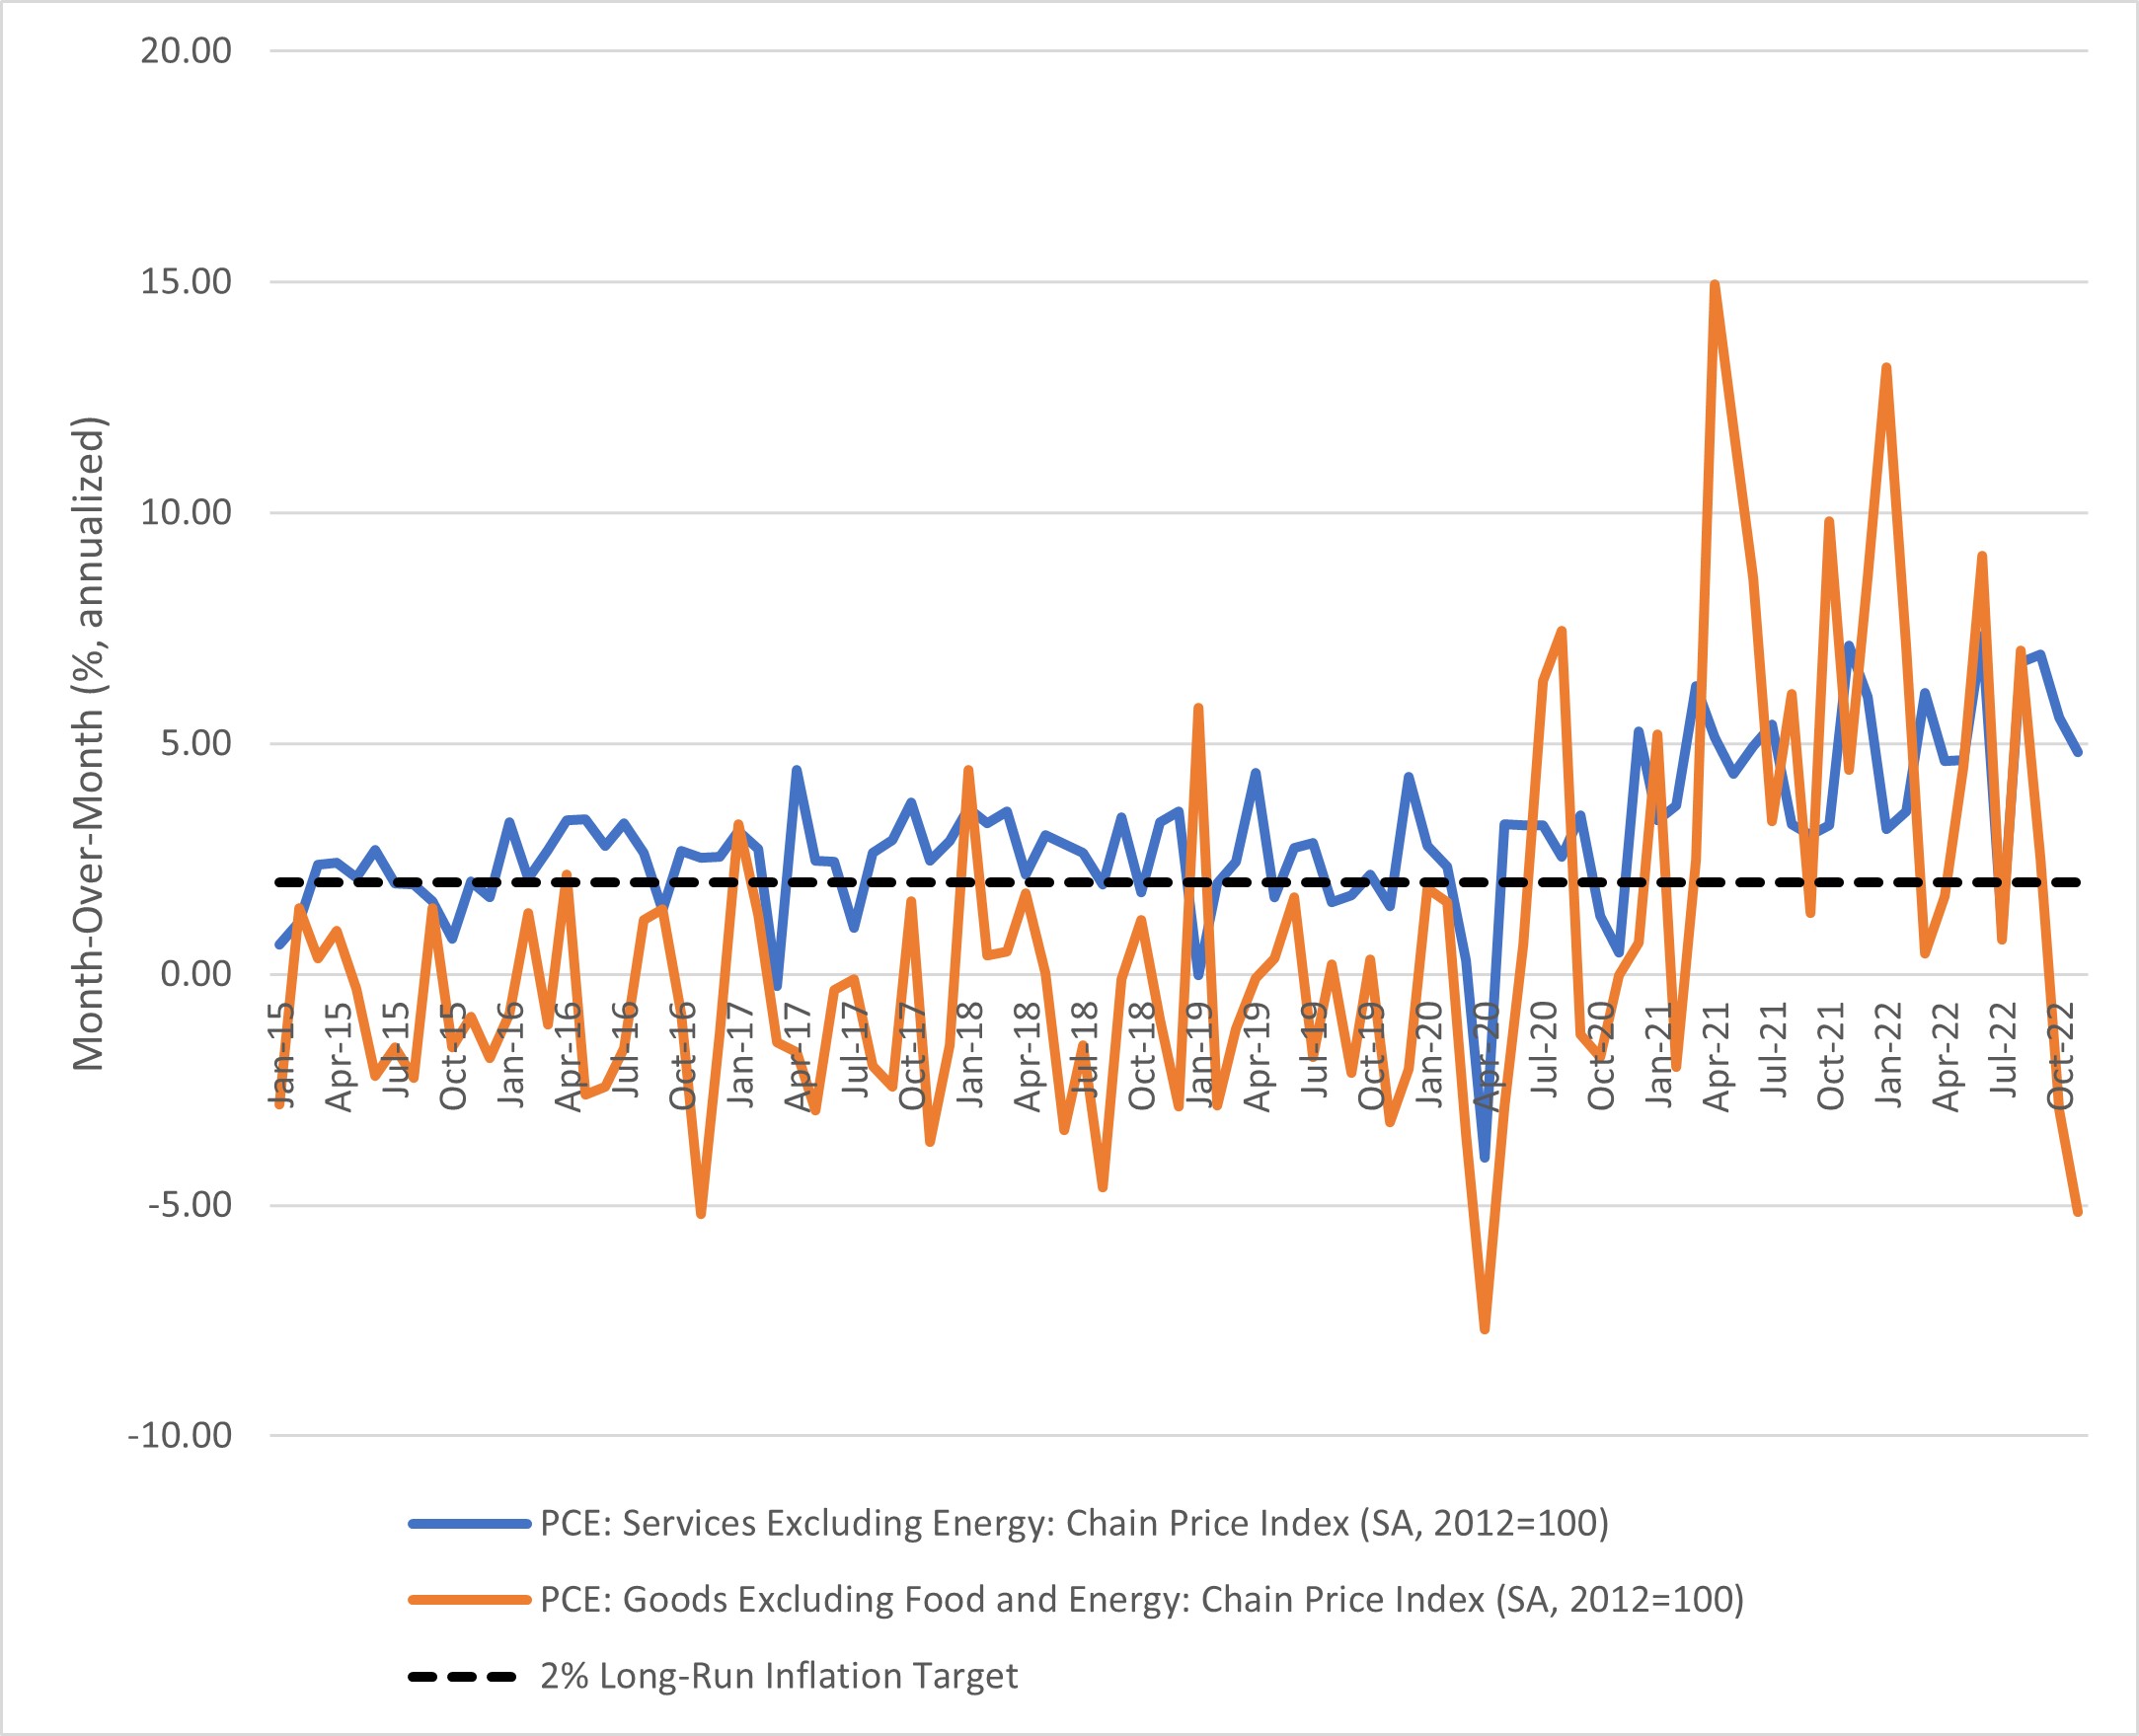
Additionally, as shown in Figure 1 below, prior to the pandemic, month-over-month growth rates of goods prices were often negative, while services prices were typically close to the FOMC's 2 percent inflation target.
In fact, in his post-FOMC press conference last month (PDF), FOMC Chair Jerome Powell specifically mentioned non-housing-related core services (where the biggest components are health care, financial services and insurance, food services, and recreation and transportation services) as important to watch for two reasons:
- Its large contribution to core inflation (about 55 percent)
- Its close relationship to the labor market, as labor costs are the biggest costs for these services providers
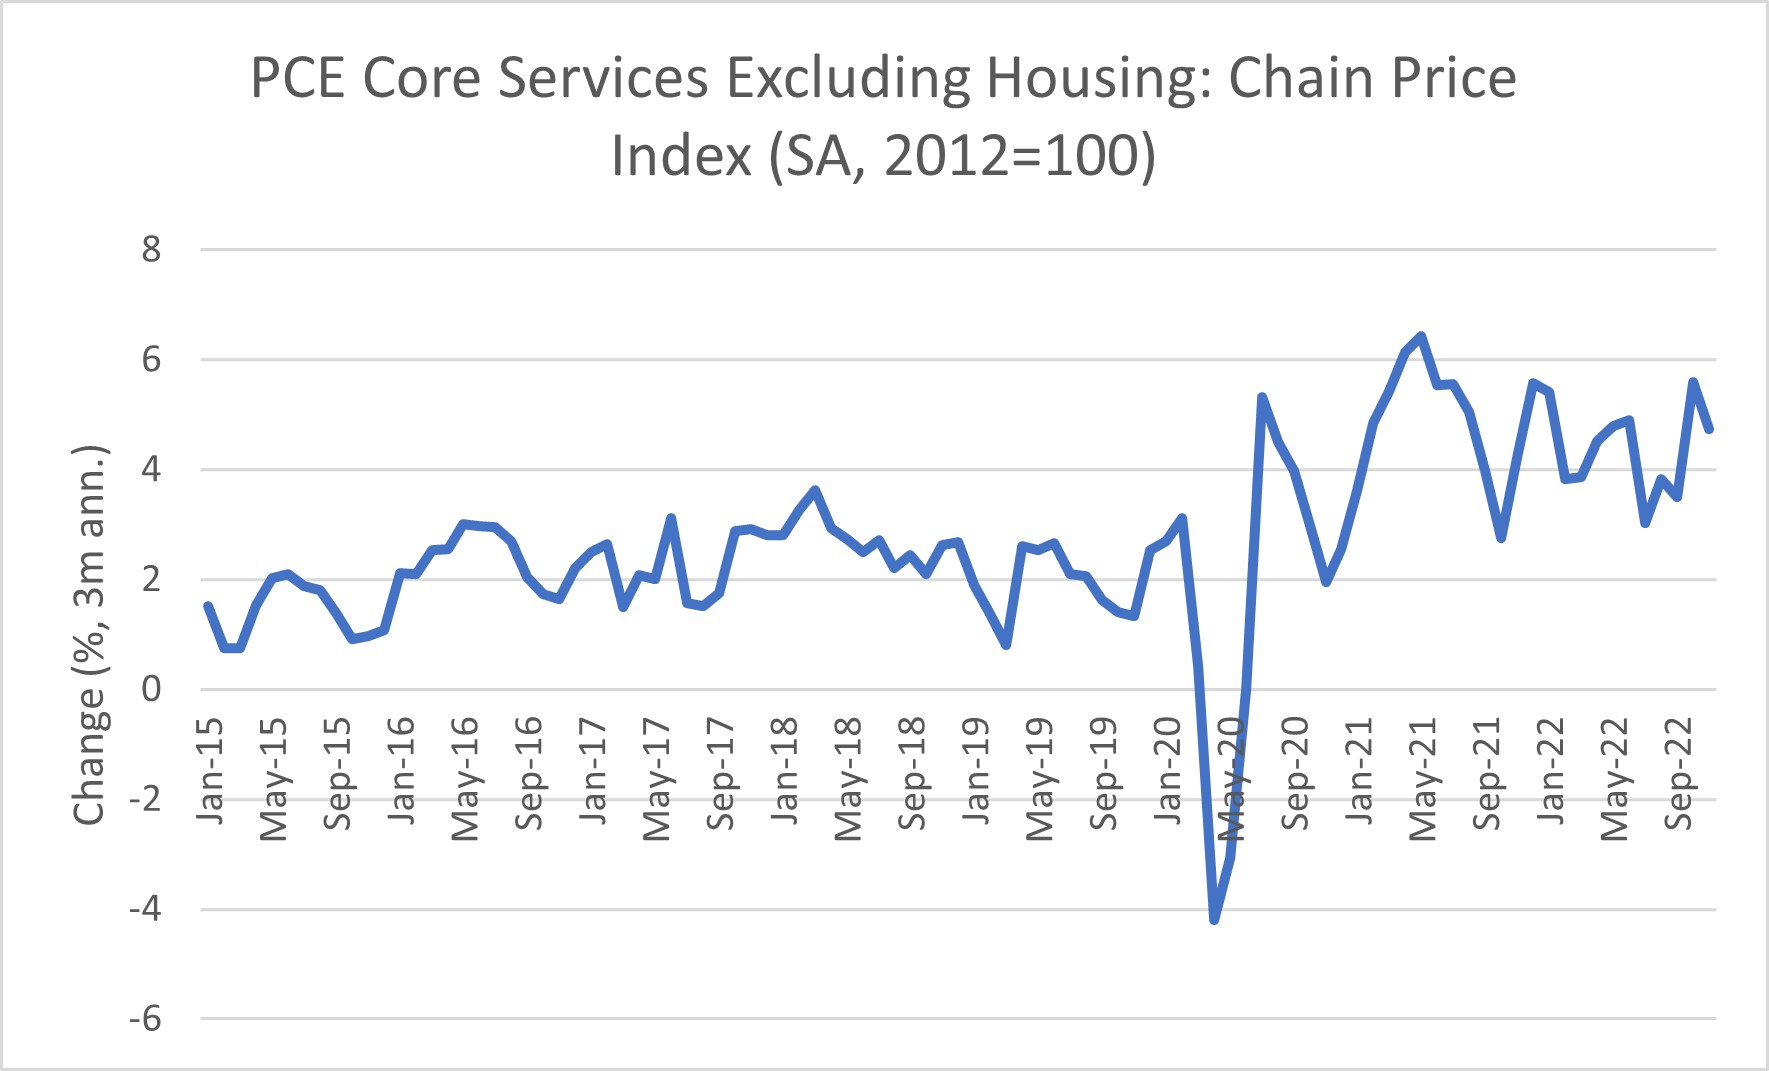
Are there signs of moderation in this important indicator? Recent months do not yet show a clear downward trend in this component. Figure 2 below shows recent inflation in core services excluding housing. We look at three-month annualized changes to smooth some of the month-to-month volatility. As of November, the three-month run rate of core services excluding housing was 4.6 percent, higher than but still close to the average for the past 18 months (4.48 percent).
Though it's encouraging that headline inflation slowed in November, if the relative prices of goods and services return to their pre-pandemic trends, a major part of returning to price stability involves normalization of inflation in services as well as goods. So, keep a close eye on services inflation in 2023.
Views expressed in this article are those of the author and not necessarily those of the Federal Reserve Bank of Richmond or the Federal Reserve System.
Some studies — such as the 2014 paper "Trimmed-Mean Inflation Statistics: Just Hit the One in the Middle," the 2019 paper "Behavior of a New Median PCE Measure: A Tale of Tails" and the 2021 paper "Measuring U.S. Core Inflation: The Stress Test of COVID-19" — find positive properties of median inflation in forecasting inflation.


