Saving, Schmaving: Why You Shouldn't Worry About Personal Saving Rates
Macro Minute
March 7, 2023
Don't worry about personal saving rates! Before you accuse me of dispensing bad financial advice, let me clarify: The personal saving rate I'm talking about isn't your individual rate of saving (which is very important) but instead is a statistic that's computed for the whole economy. The personal saving rate represents the fraction of disposable personal income that households do not spend on consumer goods and services.
Some, perhaps observing their own budgeting behavior, believe that households tend to target a particular rate of saving. Under this view, when households save too much, they'll start spending more in the future, which in aggregate lowers the personal saving rate. When they save too little, future spending will be curtailed in order build up their savings, which pushes the personal saving rate back up.
This view drives the concept of "excess savings," which became popular during the pandemic when personal saving rose as incomes were supported by fiscal transfers, while spending opportunities were simultaneously limited by business closures and supply shortages. Figure 1 below gives an update of one possible excess savings yardstick.
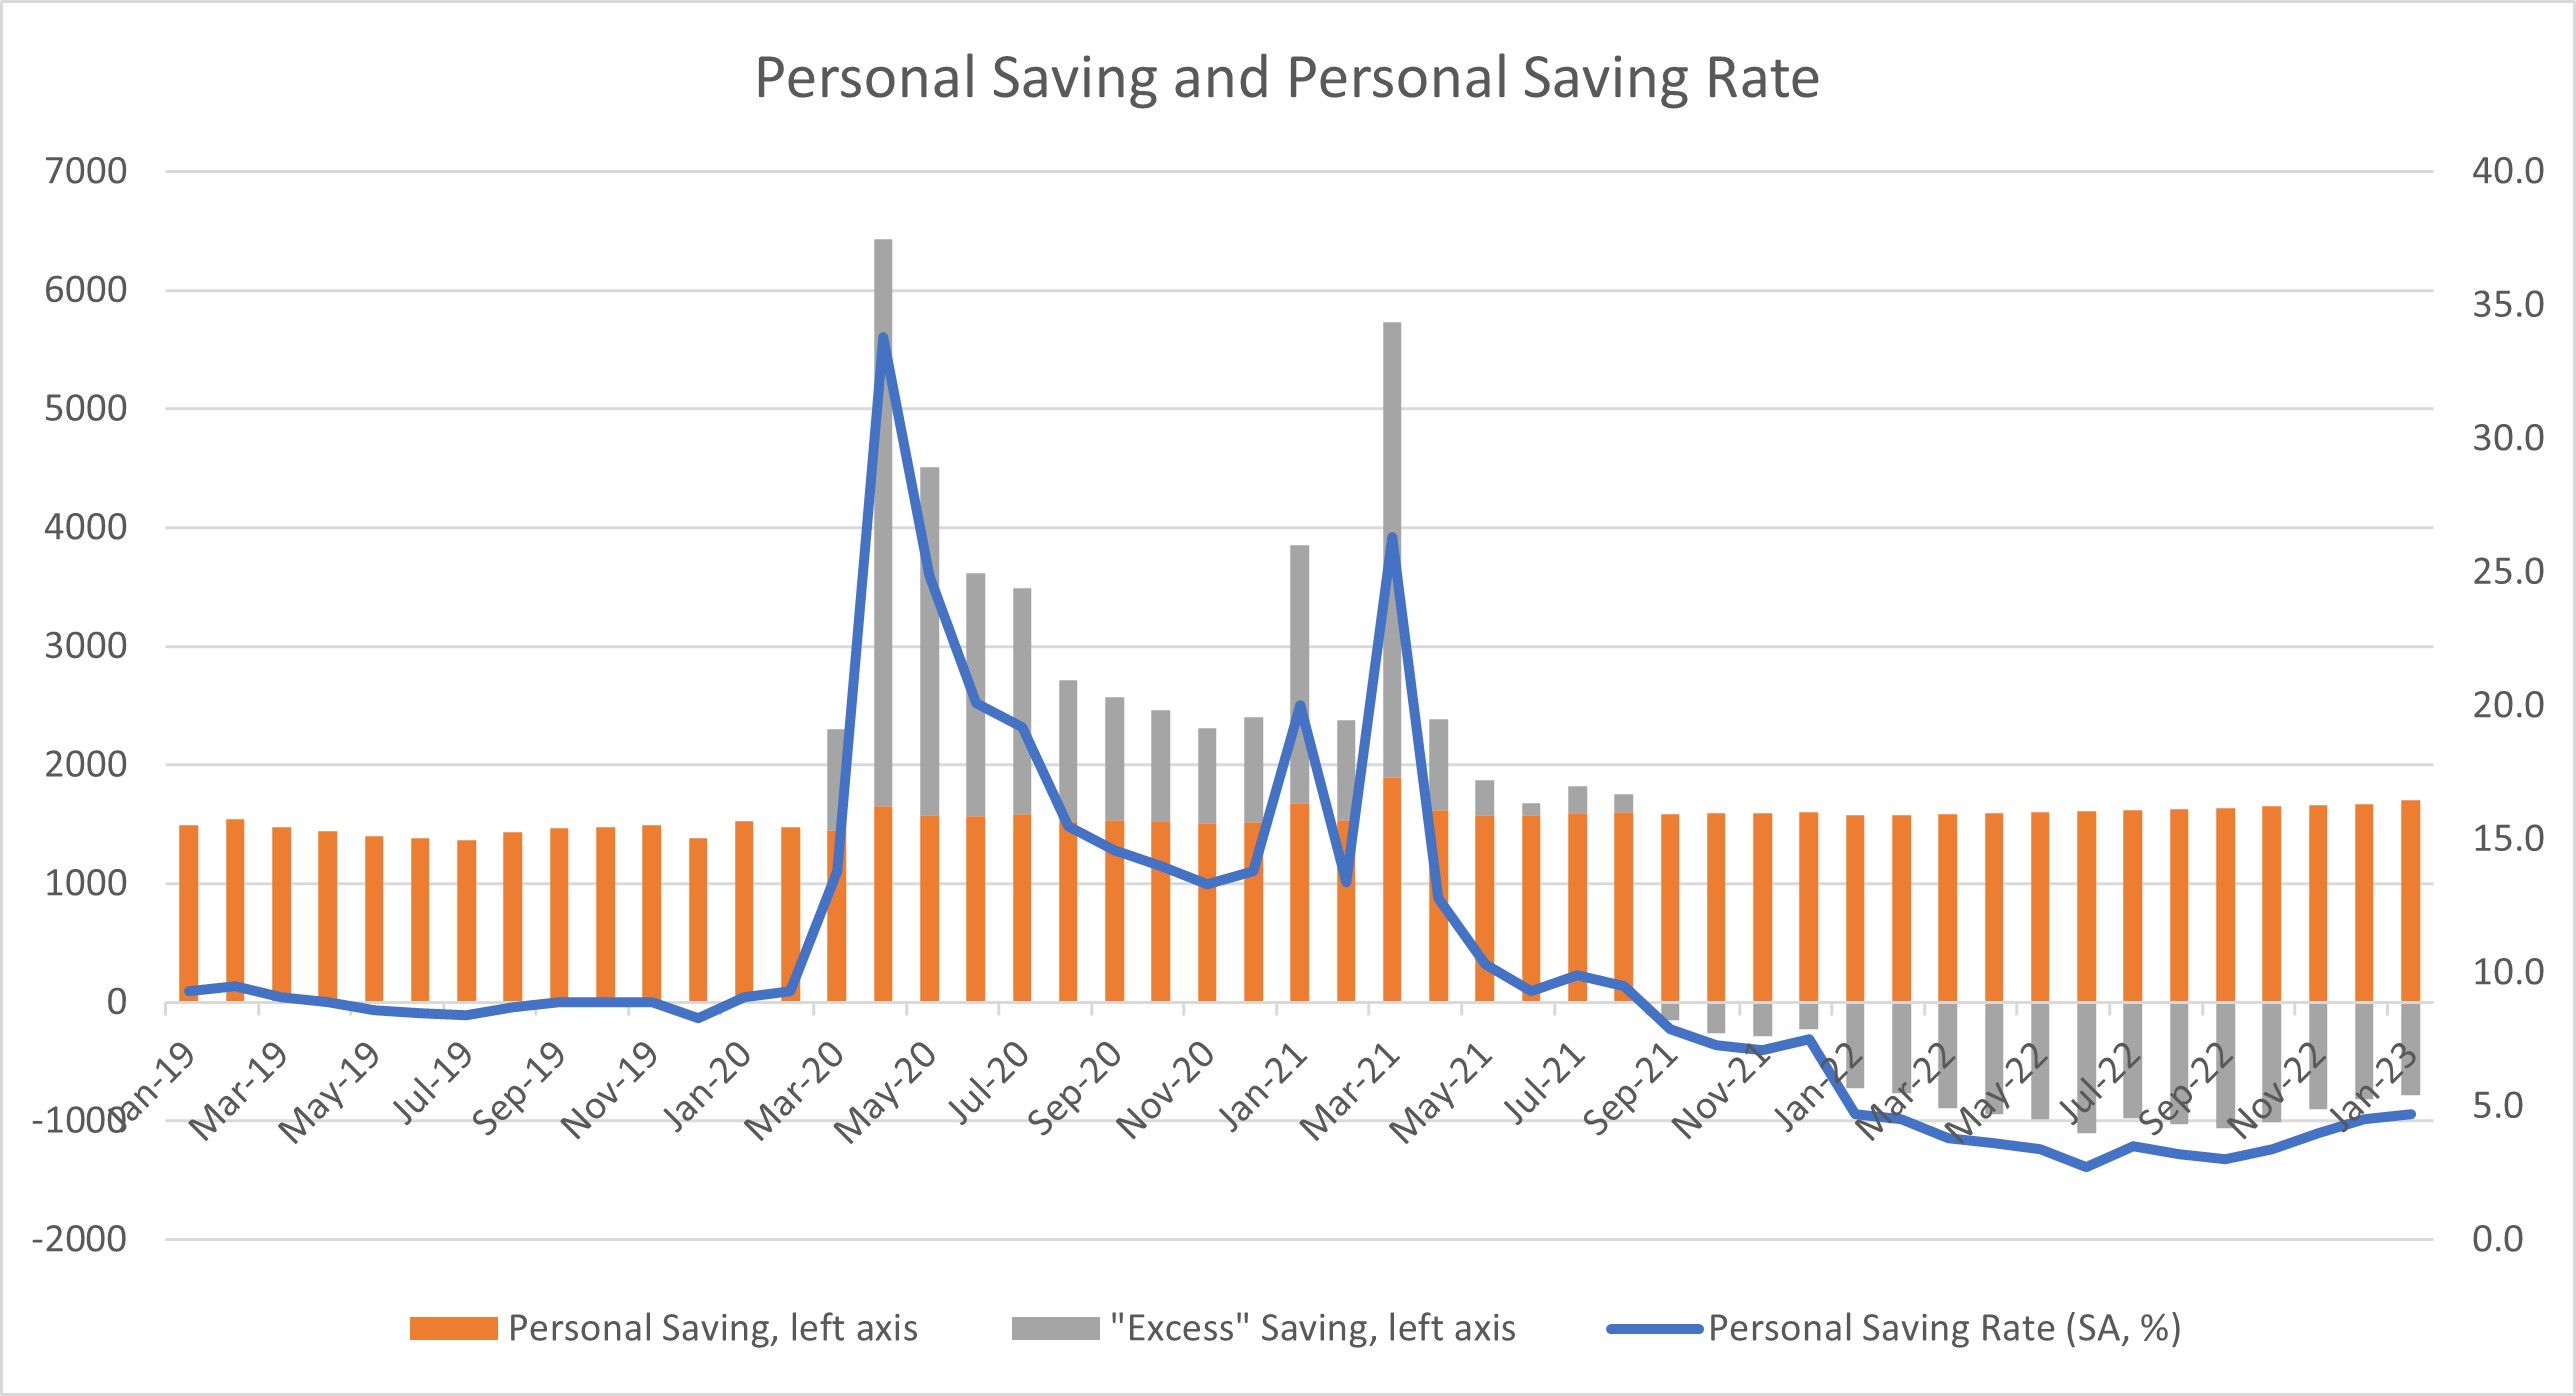
Here, excess savings (in gray) is computed as the level of personal saving above or below "normal" savings levels, which in turn are computed as monthly personal disposable income multiplied by the average personal saving rate in the fourth quarter of 2019. Summing the height of the gray bars reveals that consumers still have $1.1 trillion in excess savings as of January 2023 and have been working down their accumulated excess savings since September 2021.
Meanwhile, the personal saving rate appears to be following this cycle of saving and dissaving. In January, the personal saving rate was 4.7 percent. This has risen from a pandemic-era low of 2.7 percent in June 2022 but remains well below the 9.3 percent rate observed in February 2020. With $1.1 trillion in excess savings left to work through, this suggests that consumption is likely to remain robust for the near future, and the personal saving rate is likely to remain low as households slowly normalize back to their targeted saving goals.
Still, while narrative seems to be reasonable, the statistical connection between the personal saving rate and future consumption seems to be low from a data perspective. Figure 2 below plots the one-year lag of the personal saving rate against current year-over-year growth in real consumption. We did this to visualize the impact of past personal saving rates against future consumption growth, but mostly to line up the two big spikes in the series during the COVID-19 pandemic. The correlation between the two series since 2000 has been 0.46, suggesting some positive relationship between the two series.
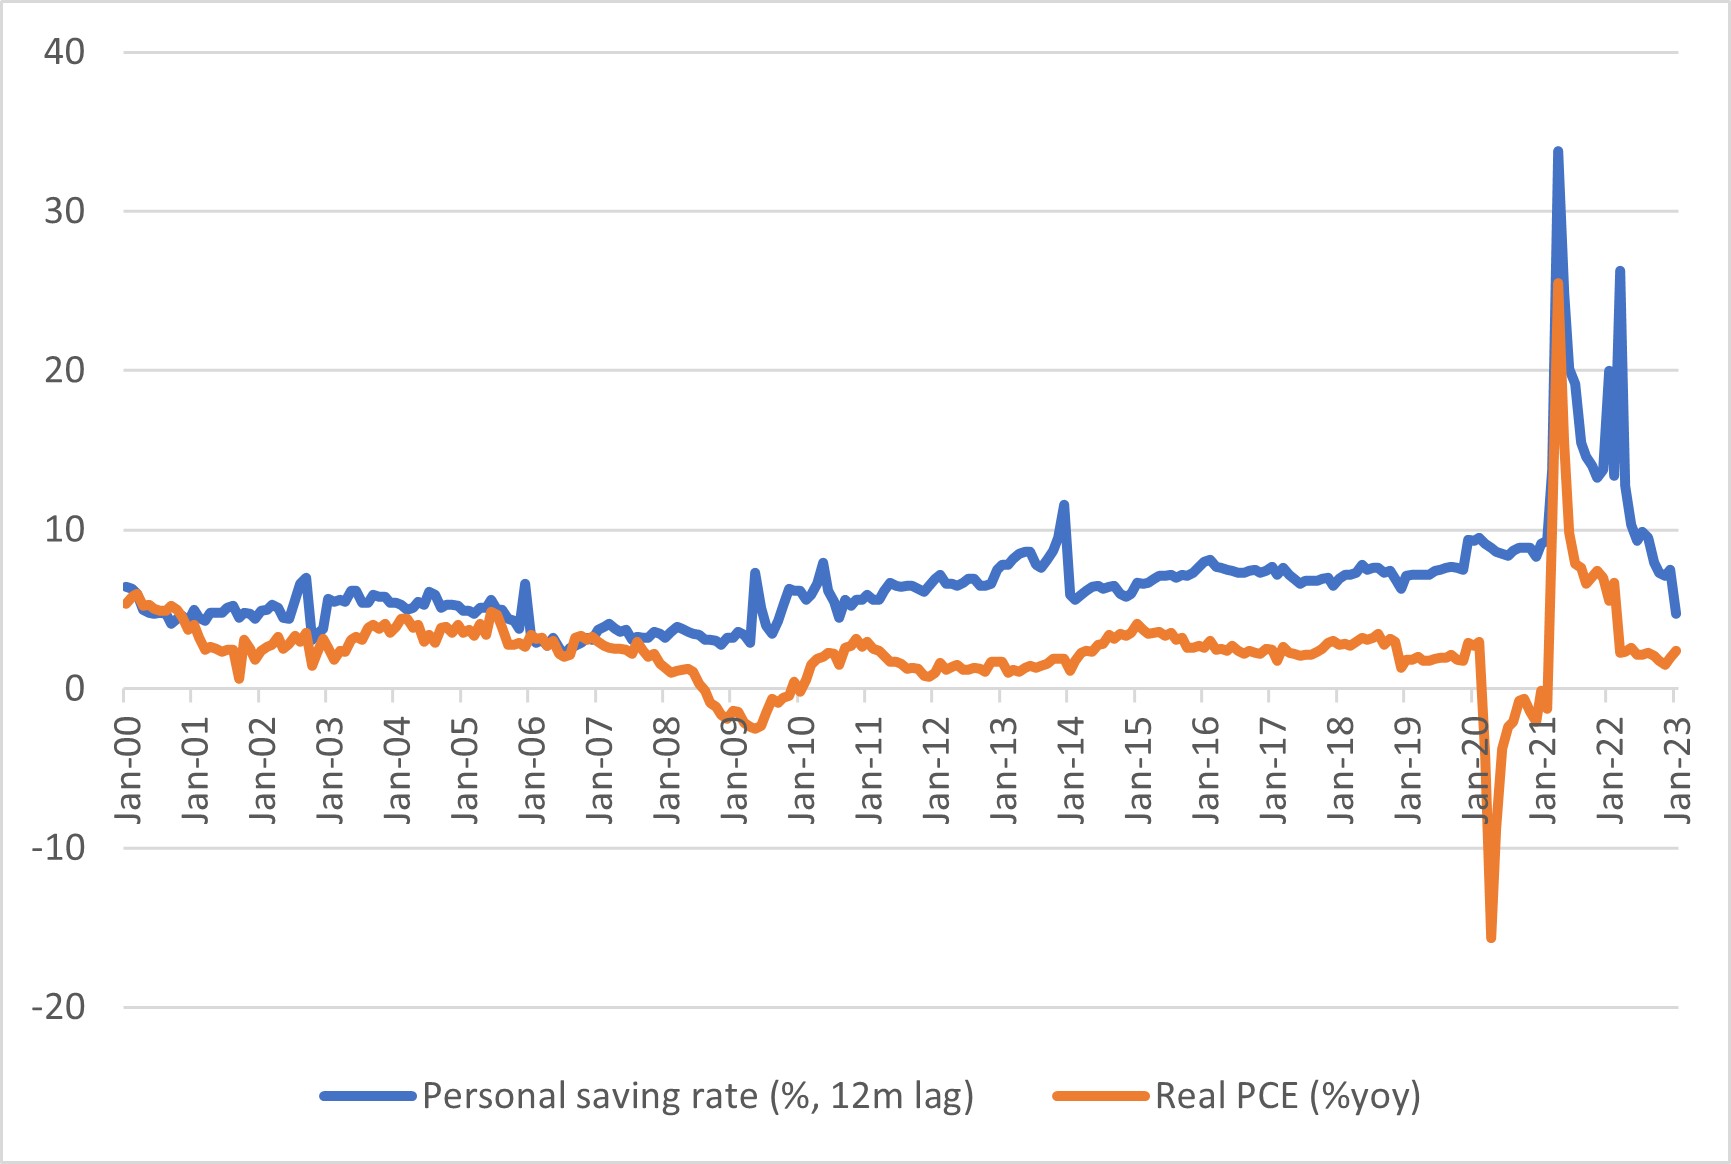
However, the link is entirely driven by the massive COVID-19 spikes. From 2000-2019, the correlation between the year-ago personal saving rate and current-period consumption growth was 0.07, or essentially zero.
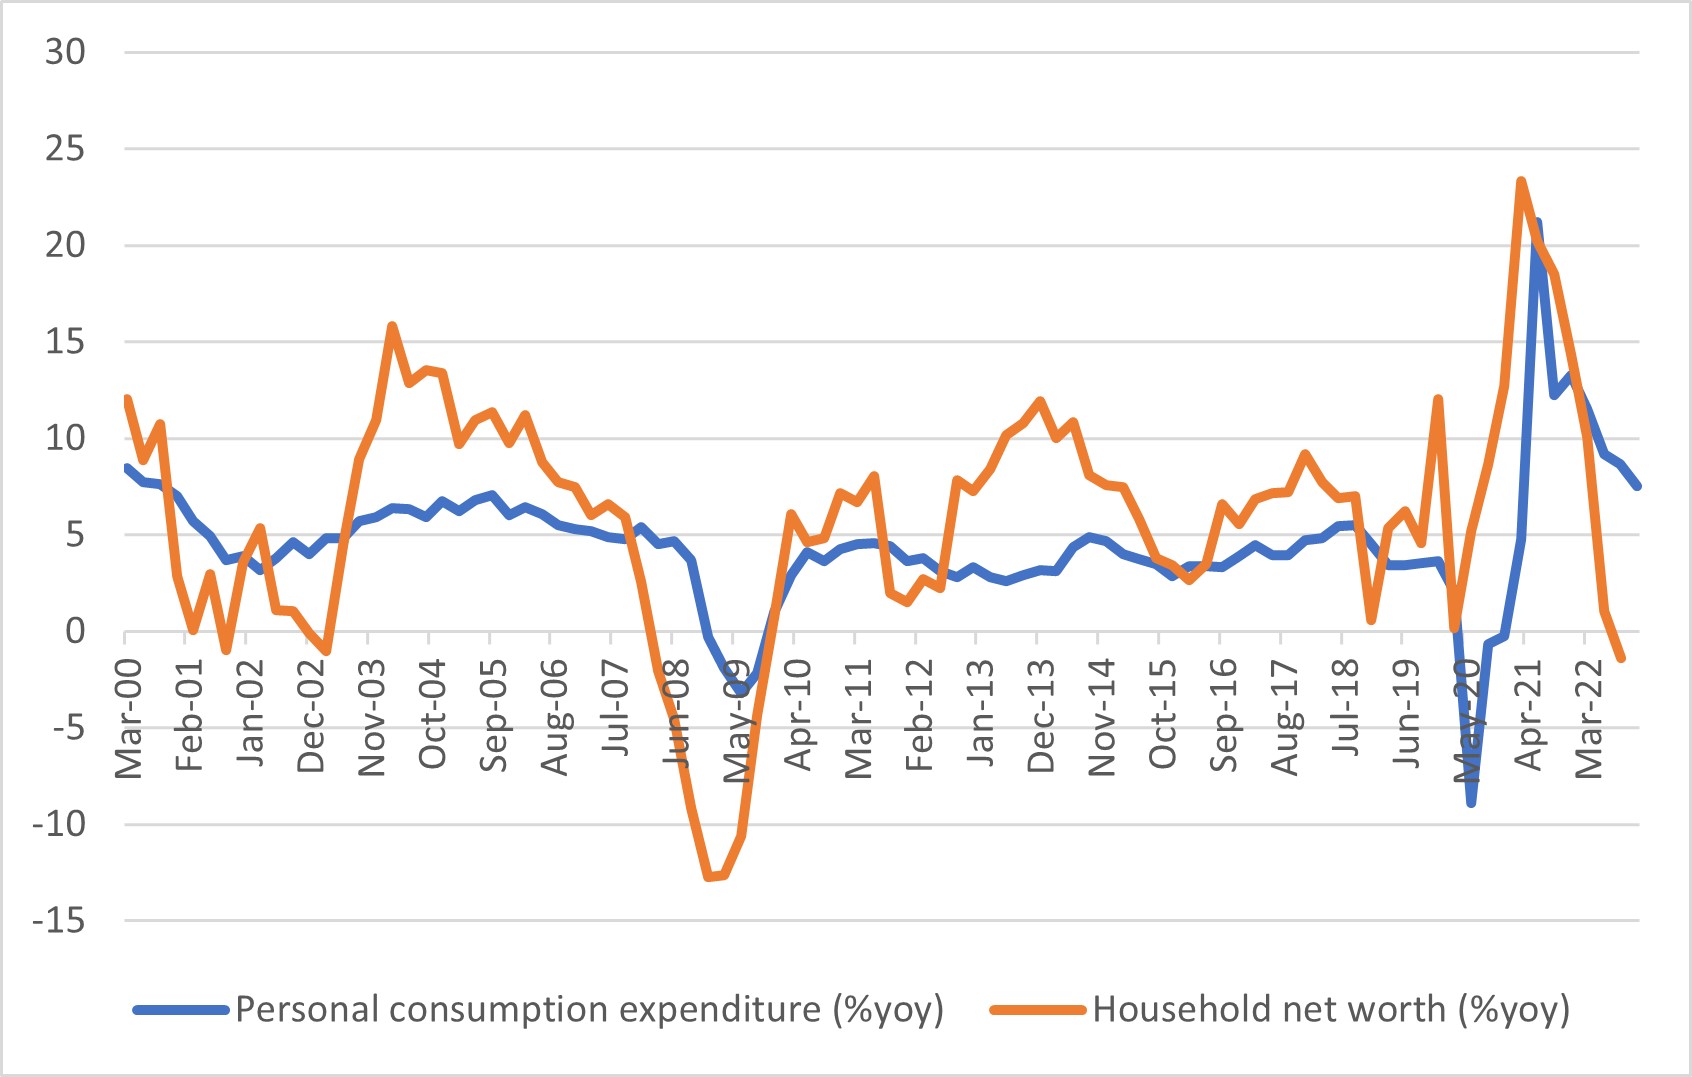
From the standpoint of economic theory, individuals target levels of wealth depending on factors like age, income and expectations of the future, and changes in wealth drive changes in consumption. Indeed, this seems to be corroborated in the data, as Figure 3 below shows a strong link between households' net worth and spending. The correlation between the two series is 0.5 and was even stronger in the 2000-2019 pre-pandemic era with a correlation of 0.65.
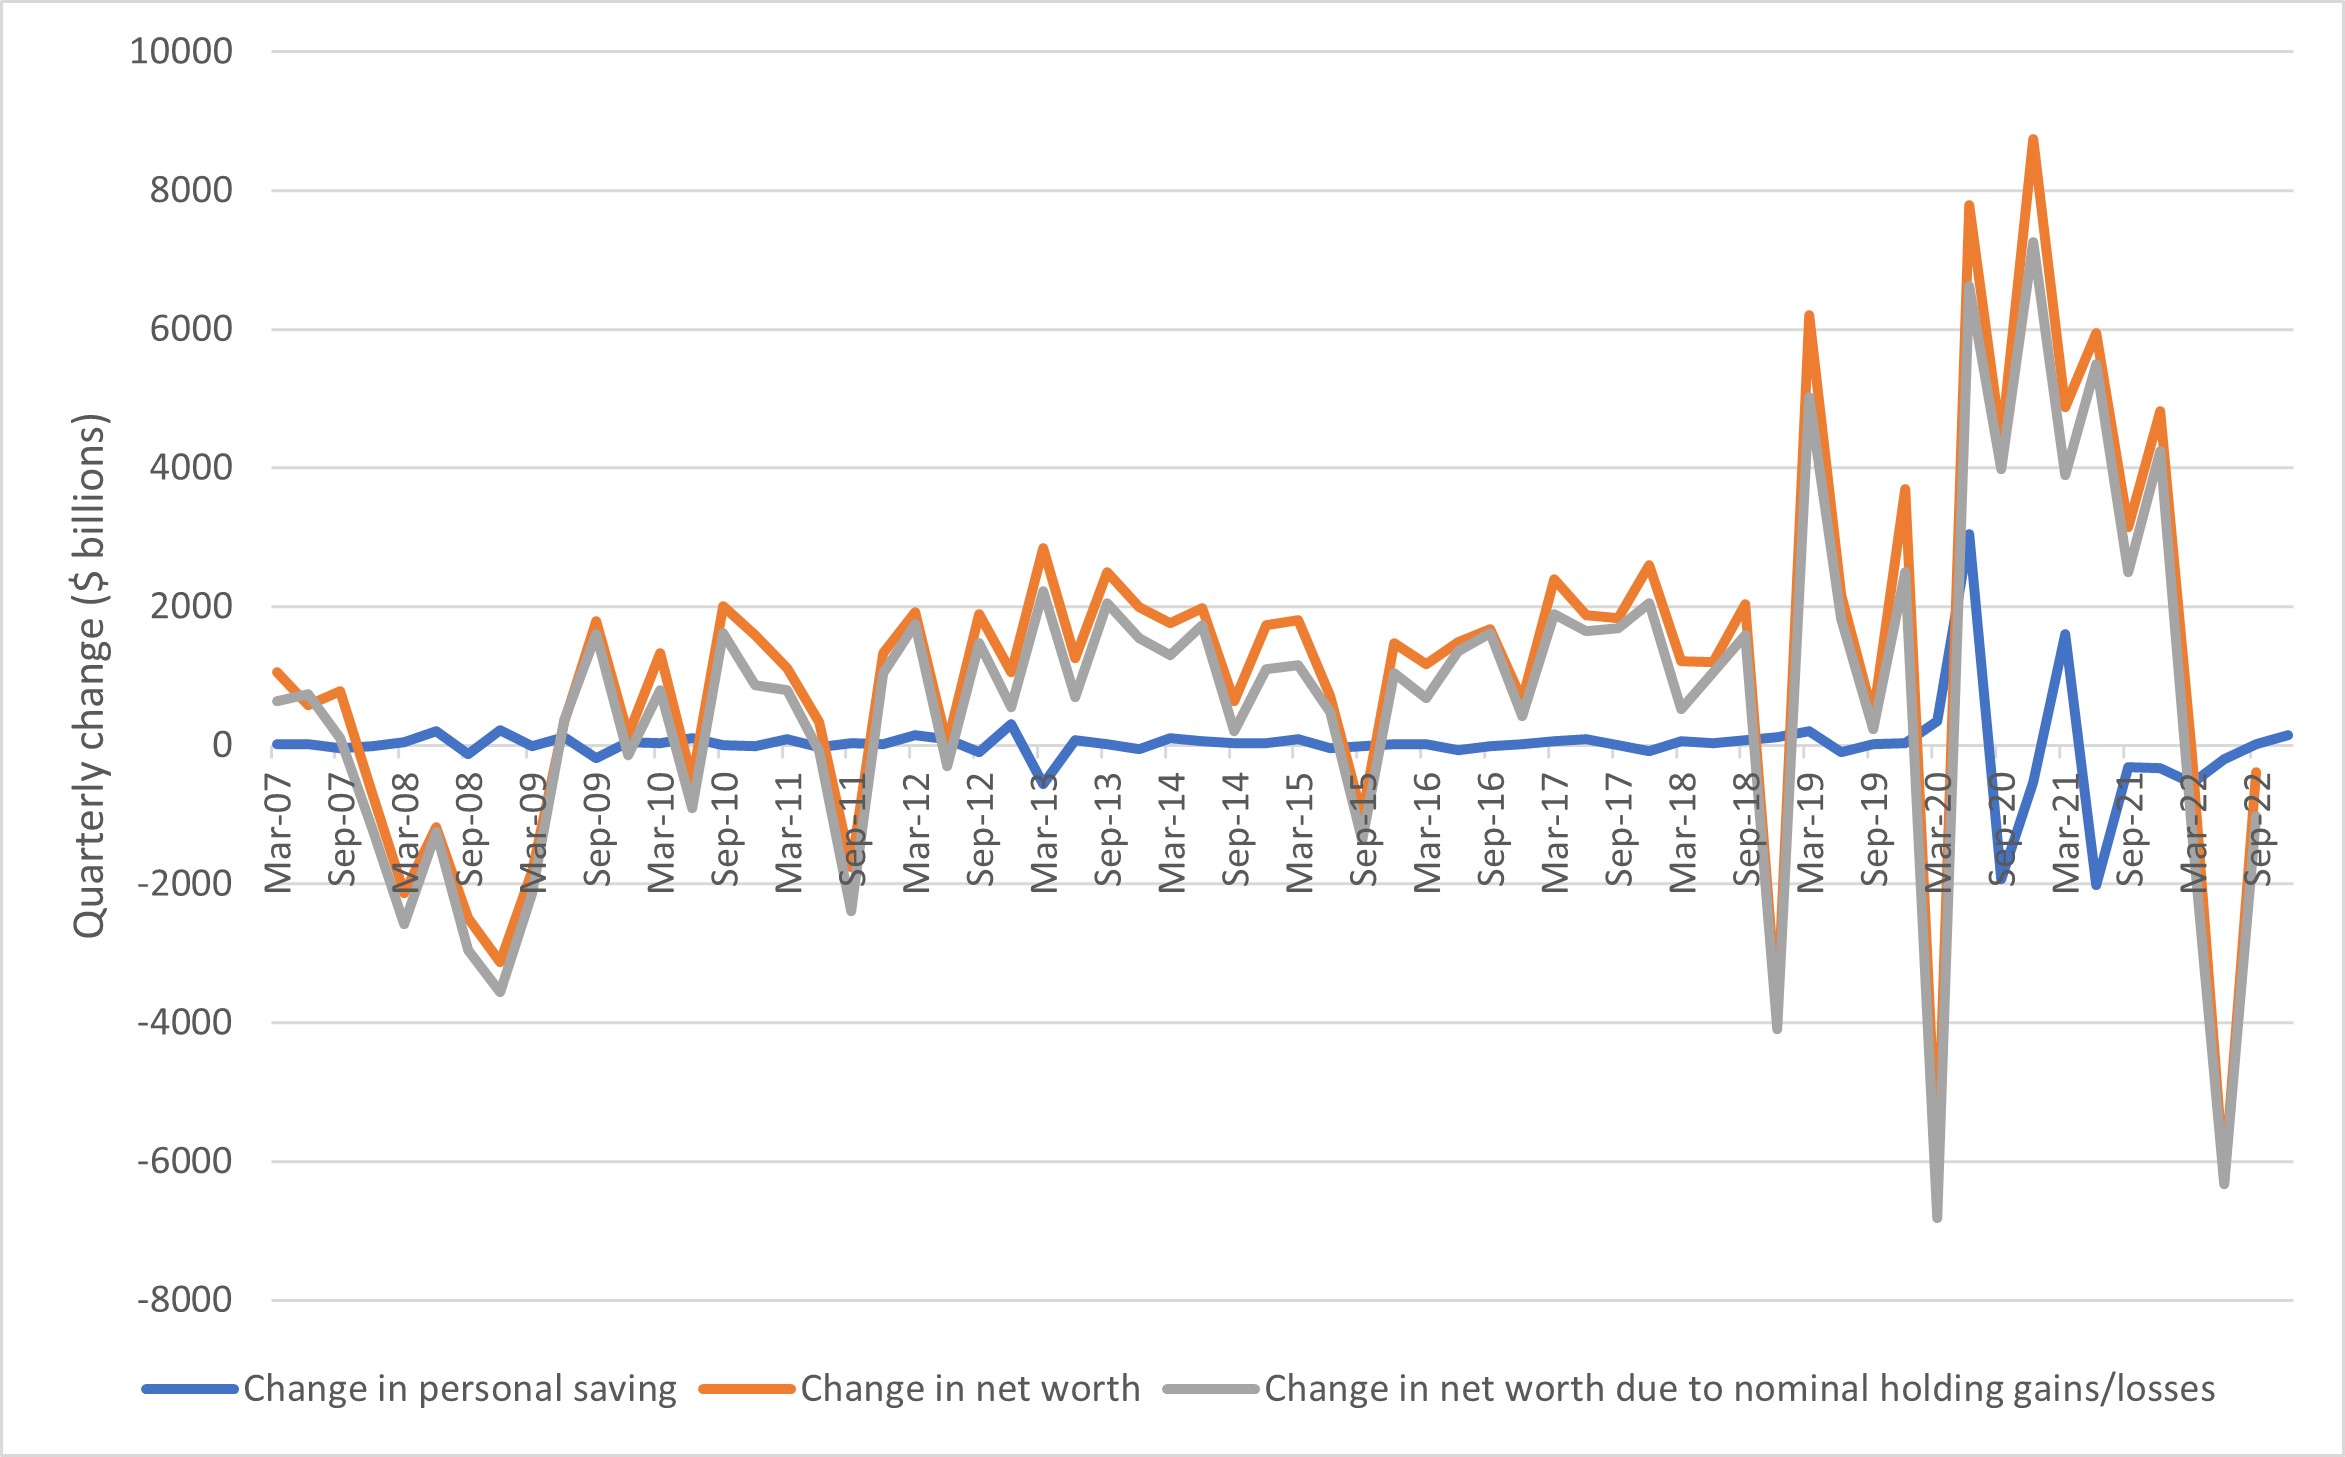
But the personal saving rate isn't tightly linked to household net worth and wealth. One reason is differences in measurement: Net worth includes consumer durables like automobiles, whereas personal saving doesn't. Additionally, when it comes to changes in net worth, the biggest driver is capital gains and losses (or changes in the prices of the assets that households own), as seen in Figure 4 below.
So don't read too much into the personal saving rate in the monthly data. Today's 4.7 percent rate may or may not return to pre-pandemic levels, and consumer spending could prove more fragile than the $1.1 trillion in "excess" savings suggests.
Views expressed in this article are those of the author and not necessarily those of the Federal Reserve Bank of Richmond or the Federal Reserve System.
Contact Us