The Landscape of Labor in Leisure and Hospitality
Will strong hiring continue in the leisure and hospitality industry? It seems like there's additional room for significant hiring to occur, but a few data sources may be showing signs that hiring in the industry could be on the verge of slowing.
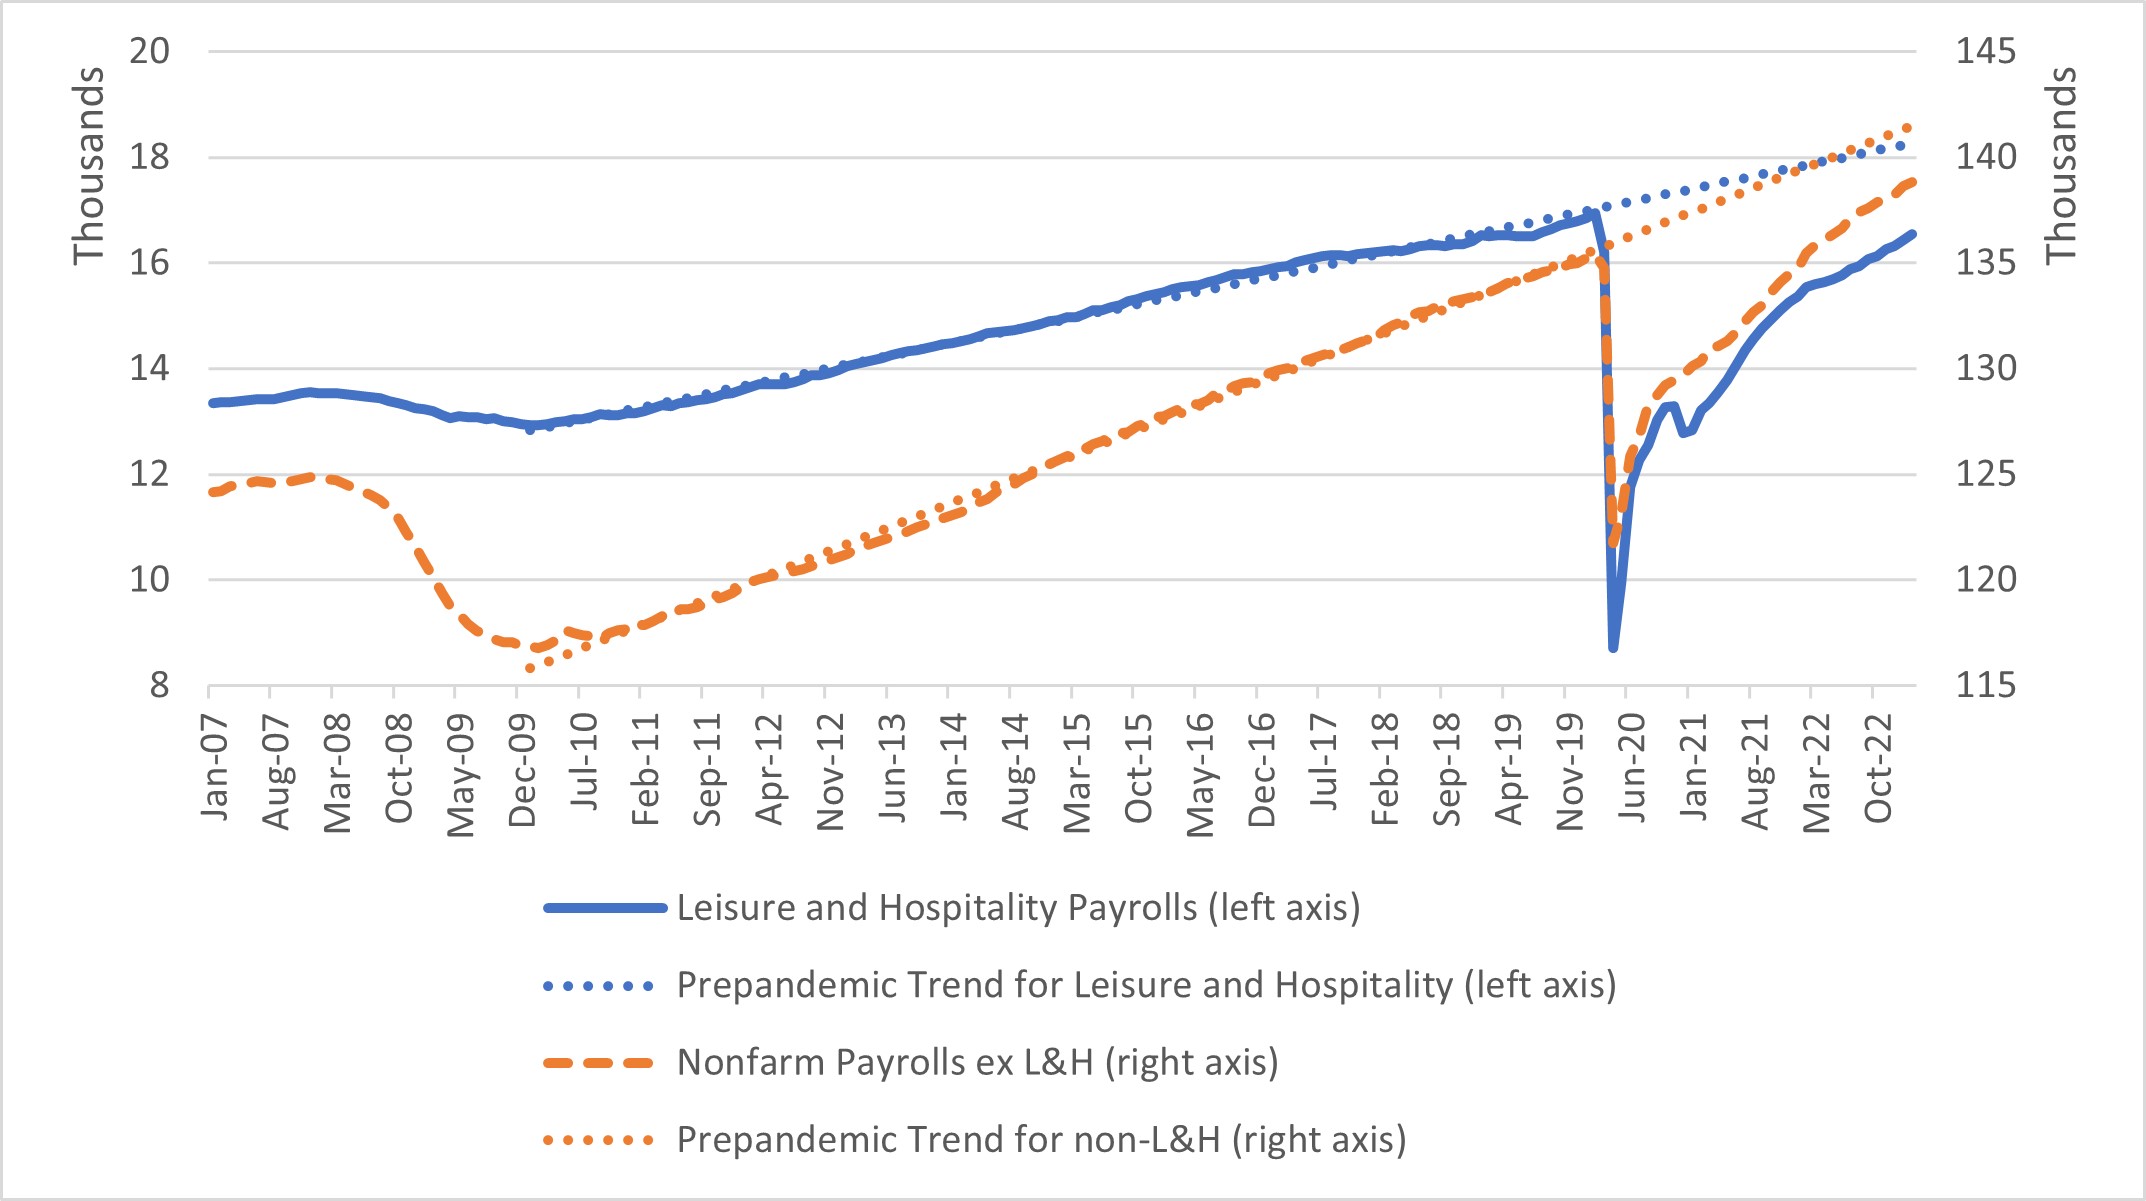
Leisure and hospitality (L&H) businesses hired over 100,000 workers in February, according to the Bureau of Labor Statistics, making it the only industry to break the six-figure mark. It also seems like these businesses have room to grow further: L&H payrolls are still lower than their pre-pandemic levels, in contrast to nonfarm payrolls in other industries which, in total, have recovered and surpassed their February 2020 levels.
Furthermore, L&H payrolls are 9.5 percent below the pre-pandemic trend, which assumes that growth would have continued at 2010-2019 rates had the pandemic not occurred. In contrast, non-L&H payrolls are less than 2 percent below their pre-pandemic trend, as seen in Figure 1 below.
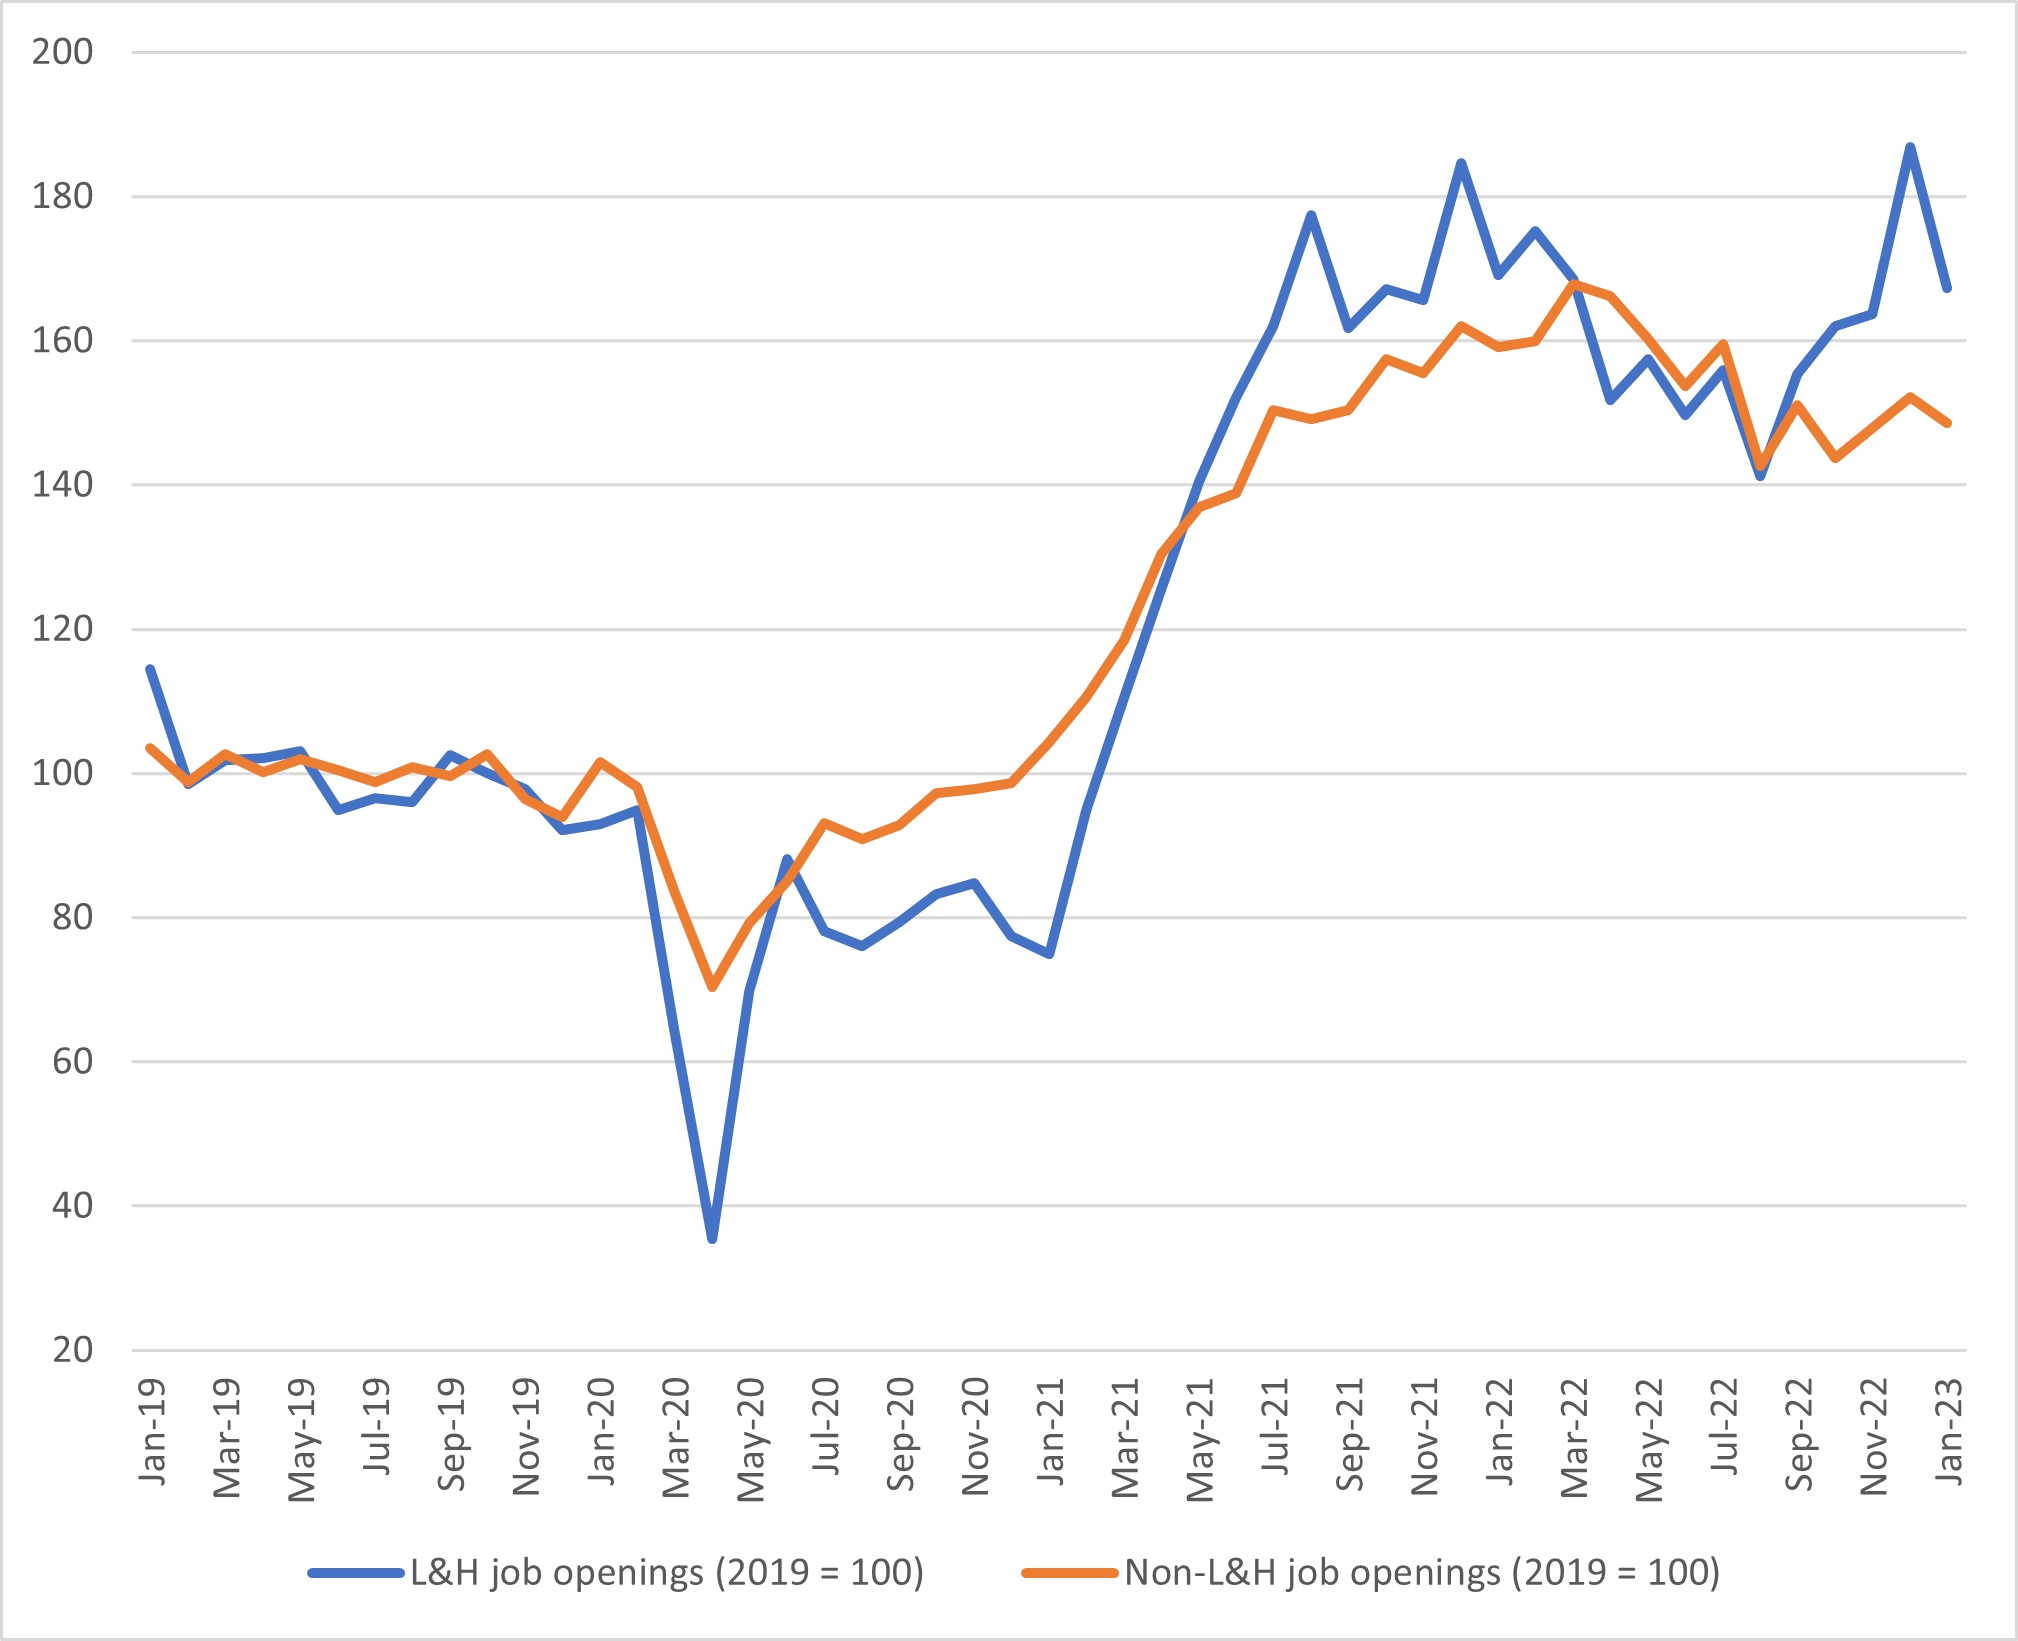
Despite strong hiring over the past year, demand for workers still appears to be high among L&H firms: As of January, there were 1.7 million open positions in the industry, up 67 percent versus 2019 average levels. Job openings are also elevated versus pre-COVID-19 levels outside of L&H, though relatively less so: Non-L&H job postings totaled 9.2 million as of January, up 48.6 percent versus 2019 average levels, as seen in Figure 2 below.
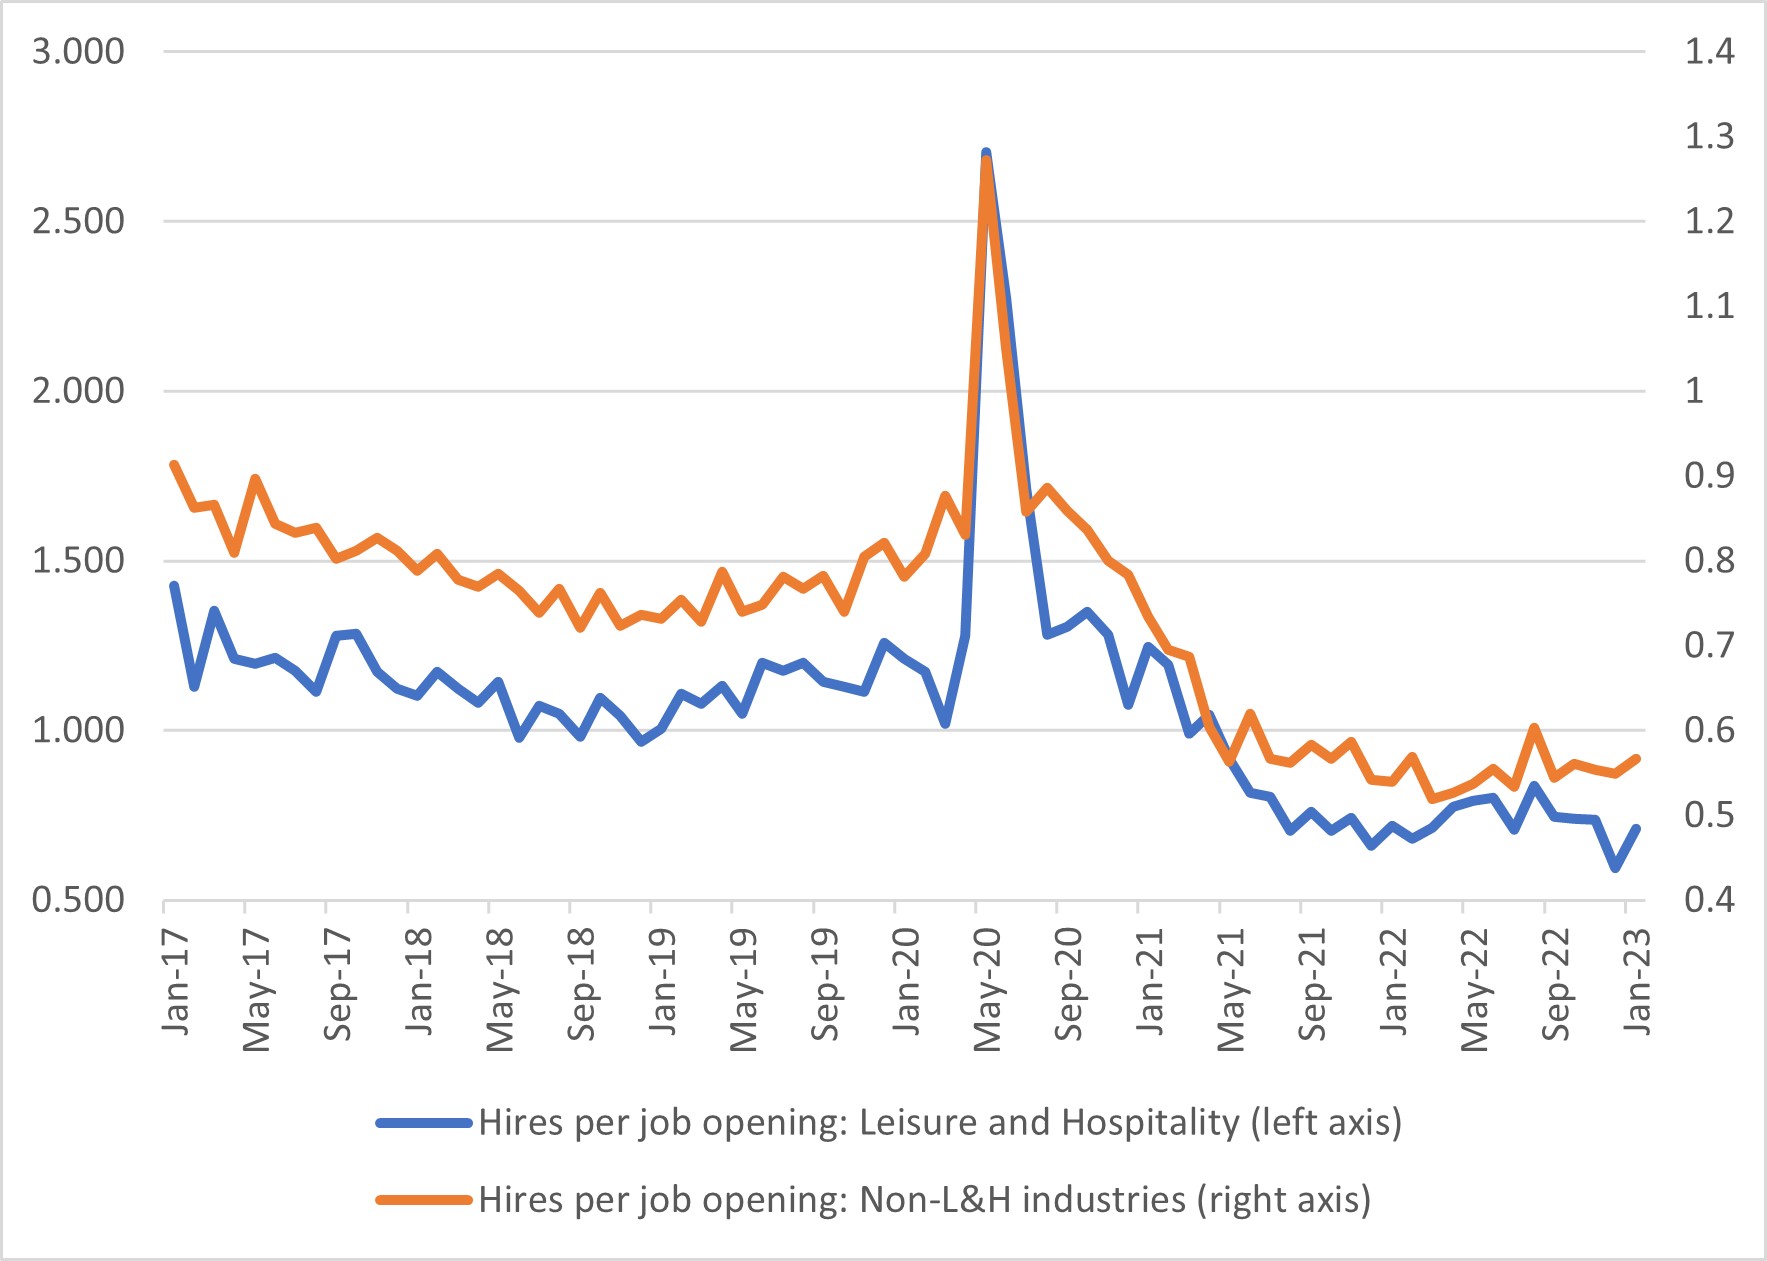
However, it's getting harder to fill these openings: The ratio of hires per job opening fell to 0.71 in January 2023 compared to 1.21 in January 2020, a decline of 50 basis points. In comparison, the ratio of hires per job opening in non-L&H industries fell to 0.57 in January 2023 compared to 0.78 in January 2020, a smaller decline of 21 basis points. (See Figure 3 below.)
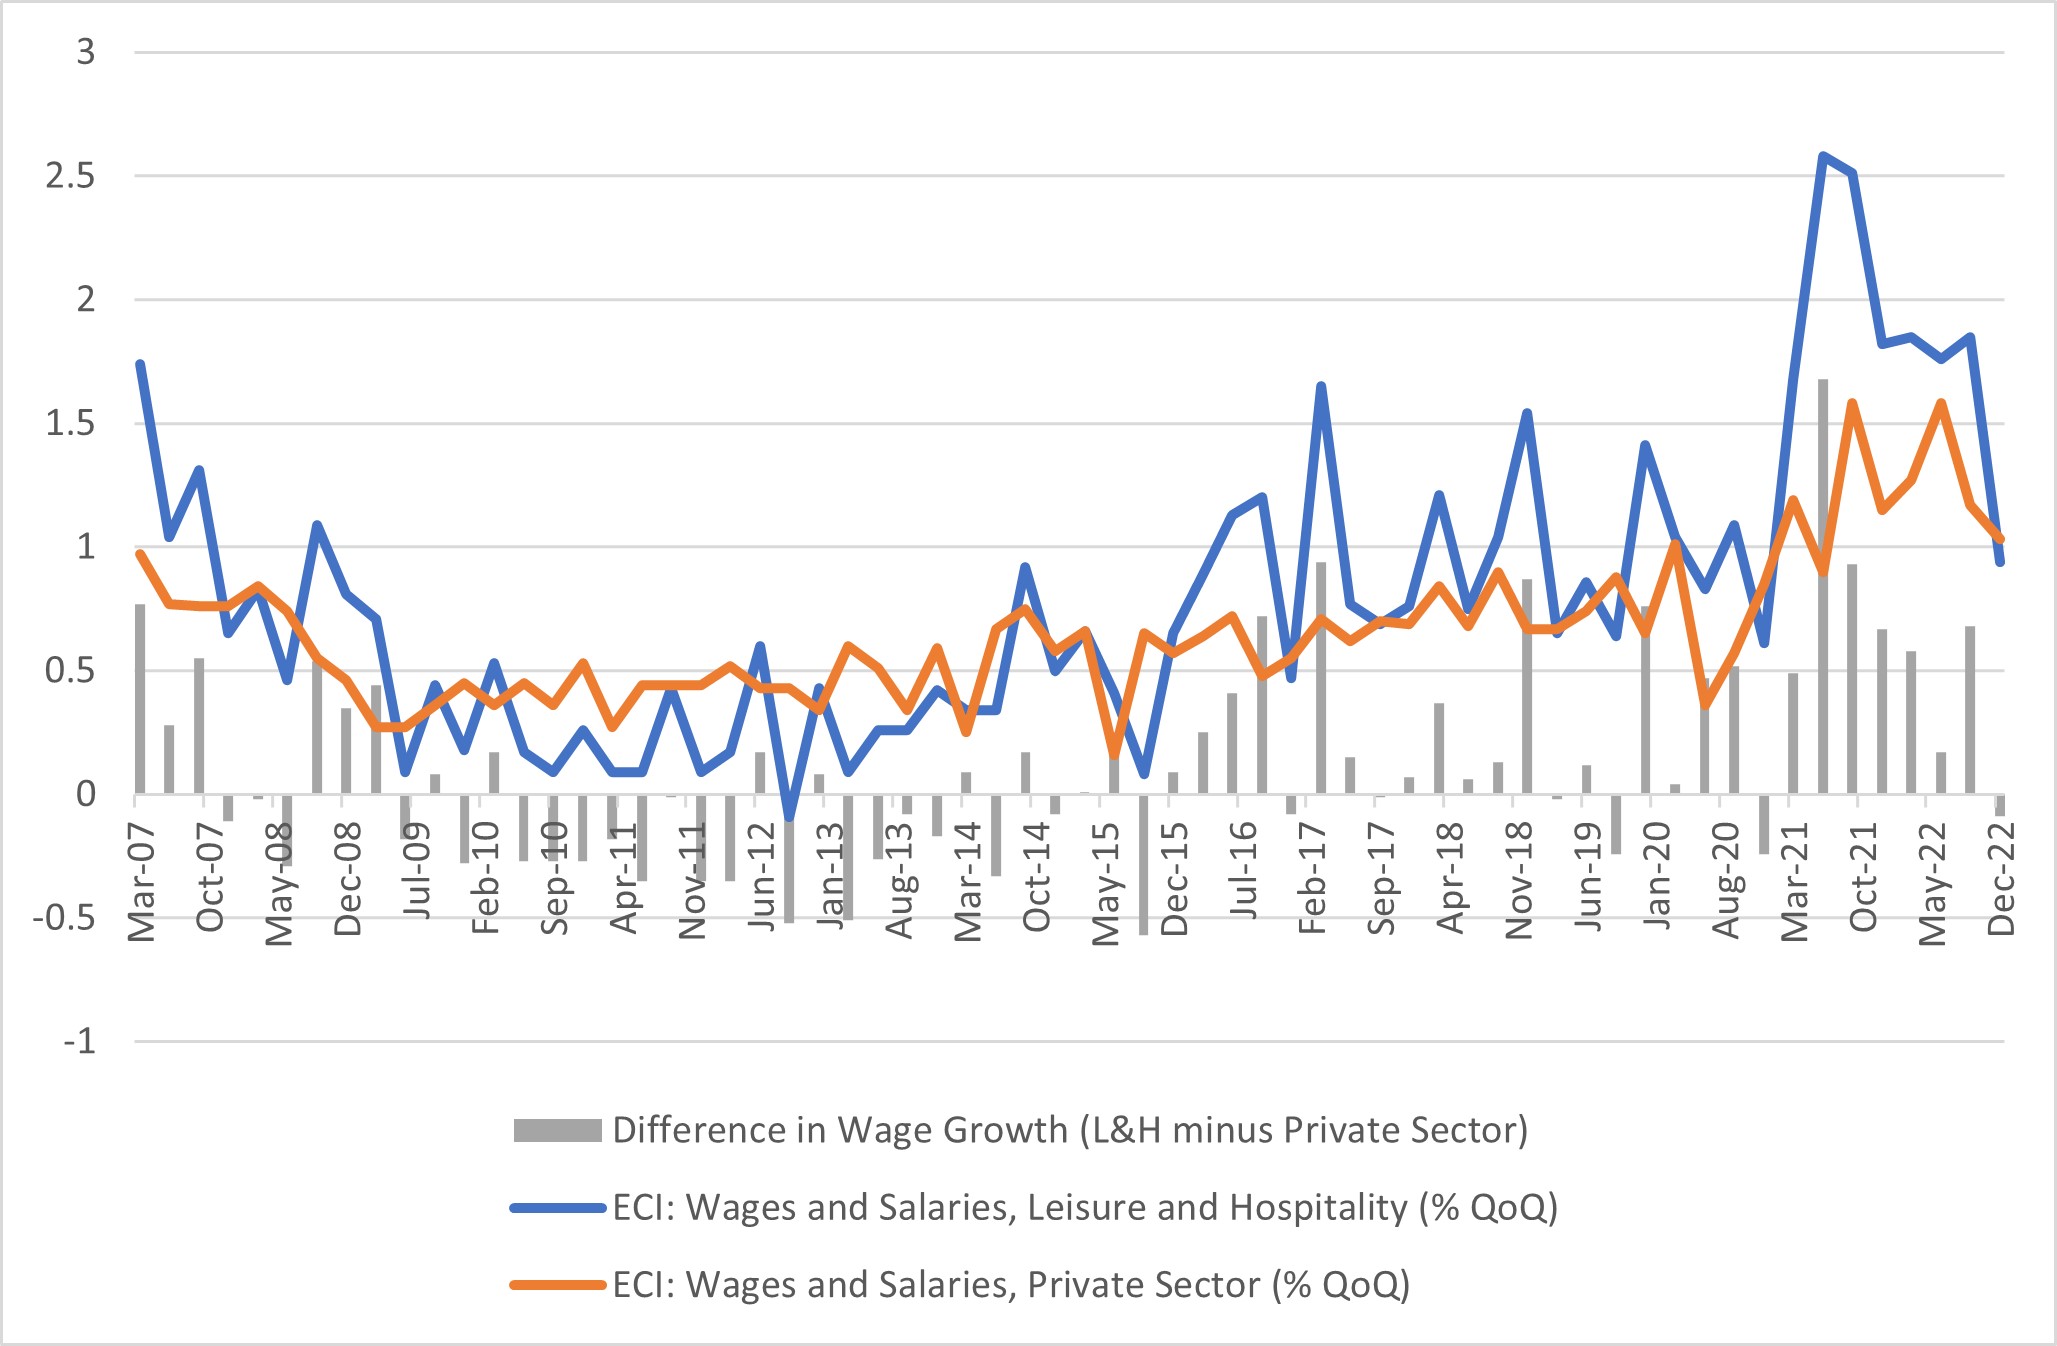
There are signs that L&H employers are feeling less stressed about their staffing levels, which could possibly be a precursor to slower hiring ahead. Wage growth in the industry has fallen to pre-pandemic levels after a year of unusually rapid wage increases. Furthermore, after seven straight quarters where quarter-over-quarter growth in L&H wages and salaries surpassed the overall average, L&H wage growth fell below the overall average in the latest quarter of data, as seen in Figure 4 below. If L&H employers were feeling desperate for workers, they would still be increasing wages rapidly relative to other industries to attract job applicants.
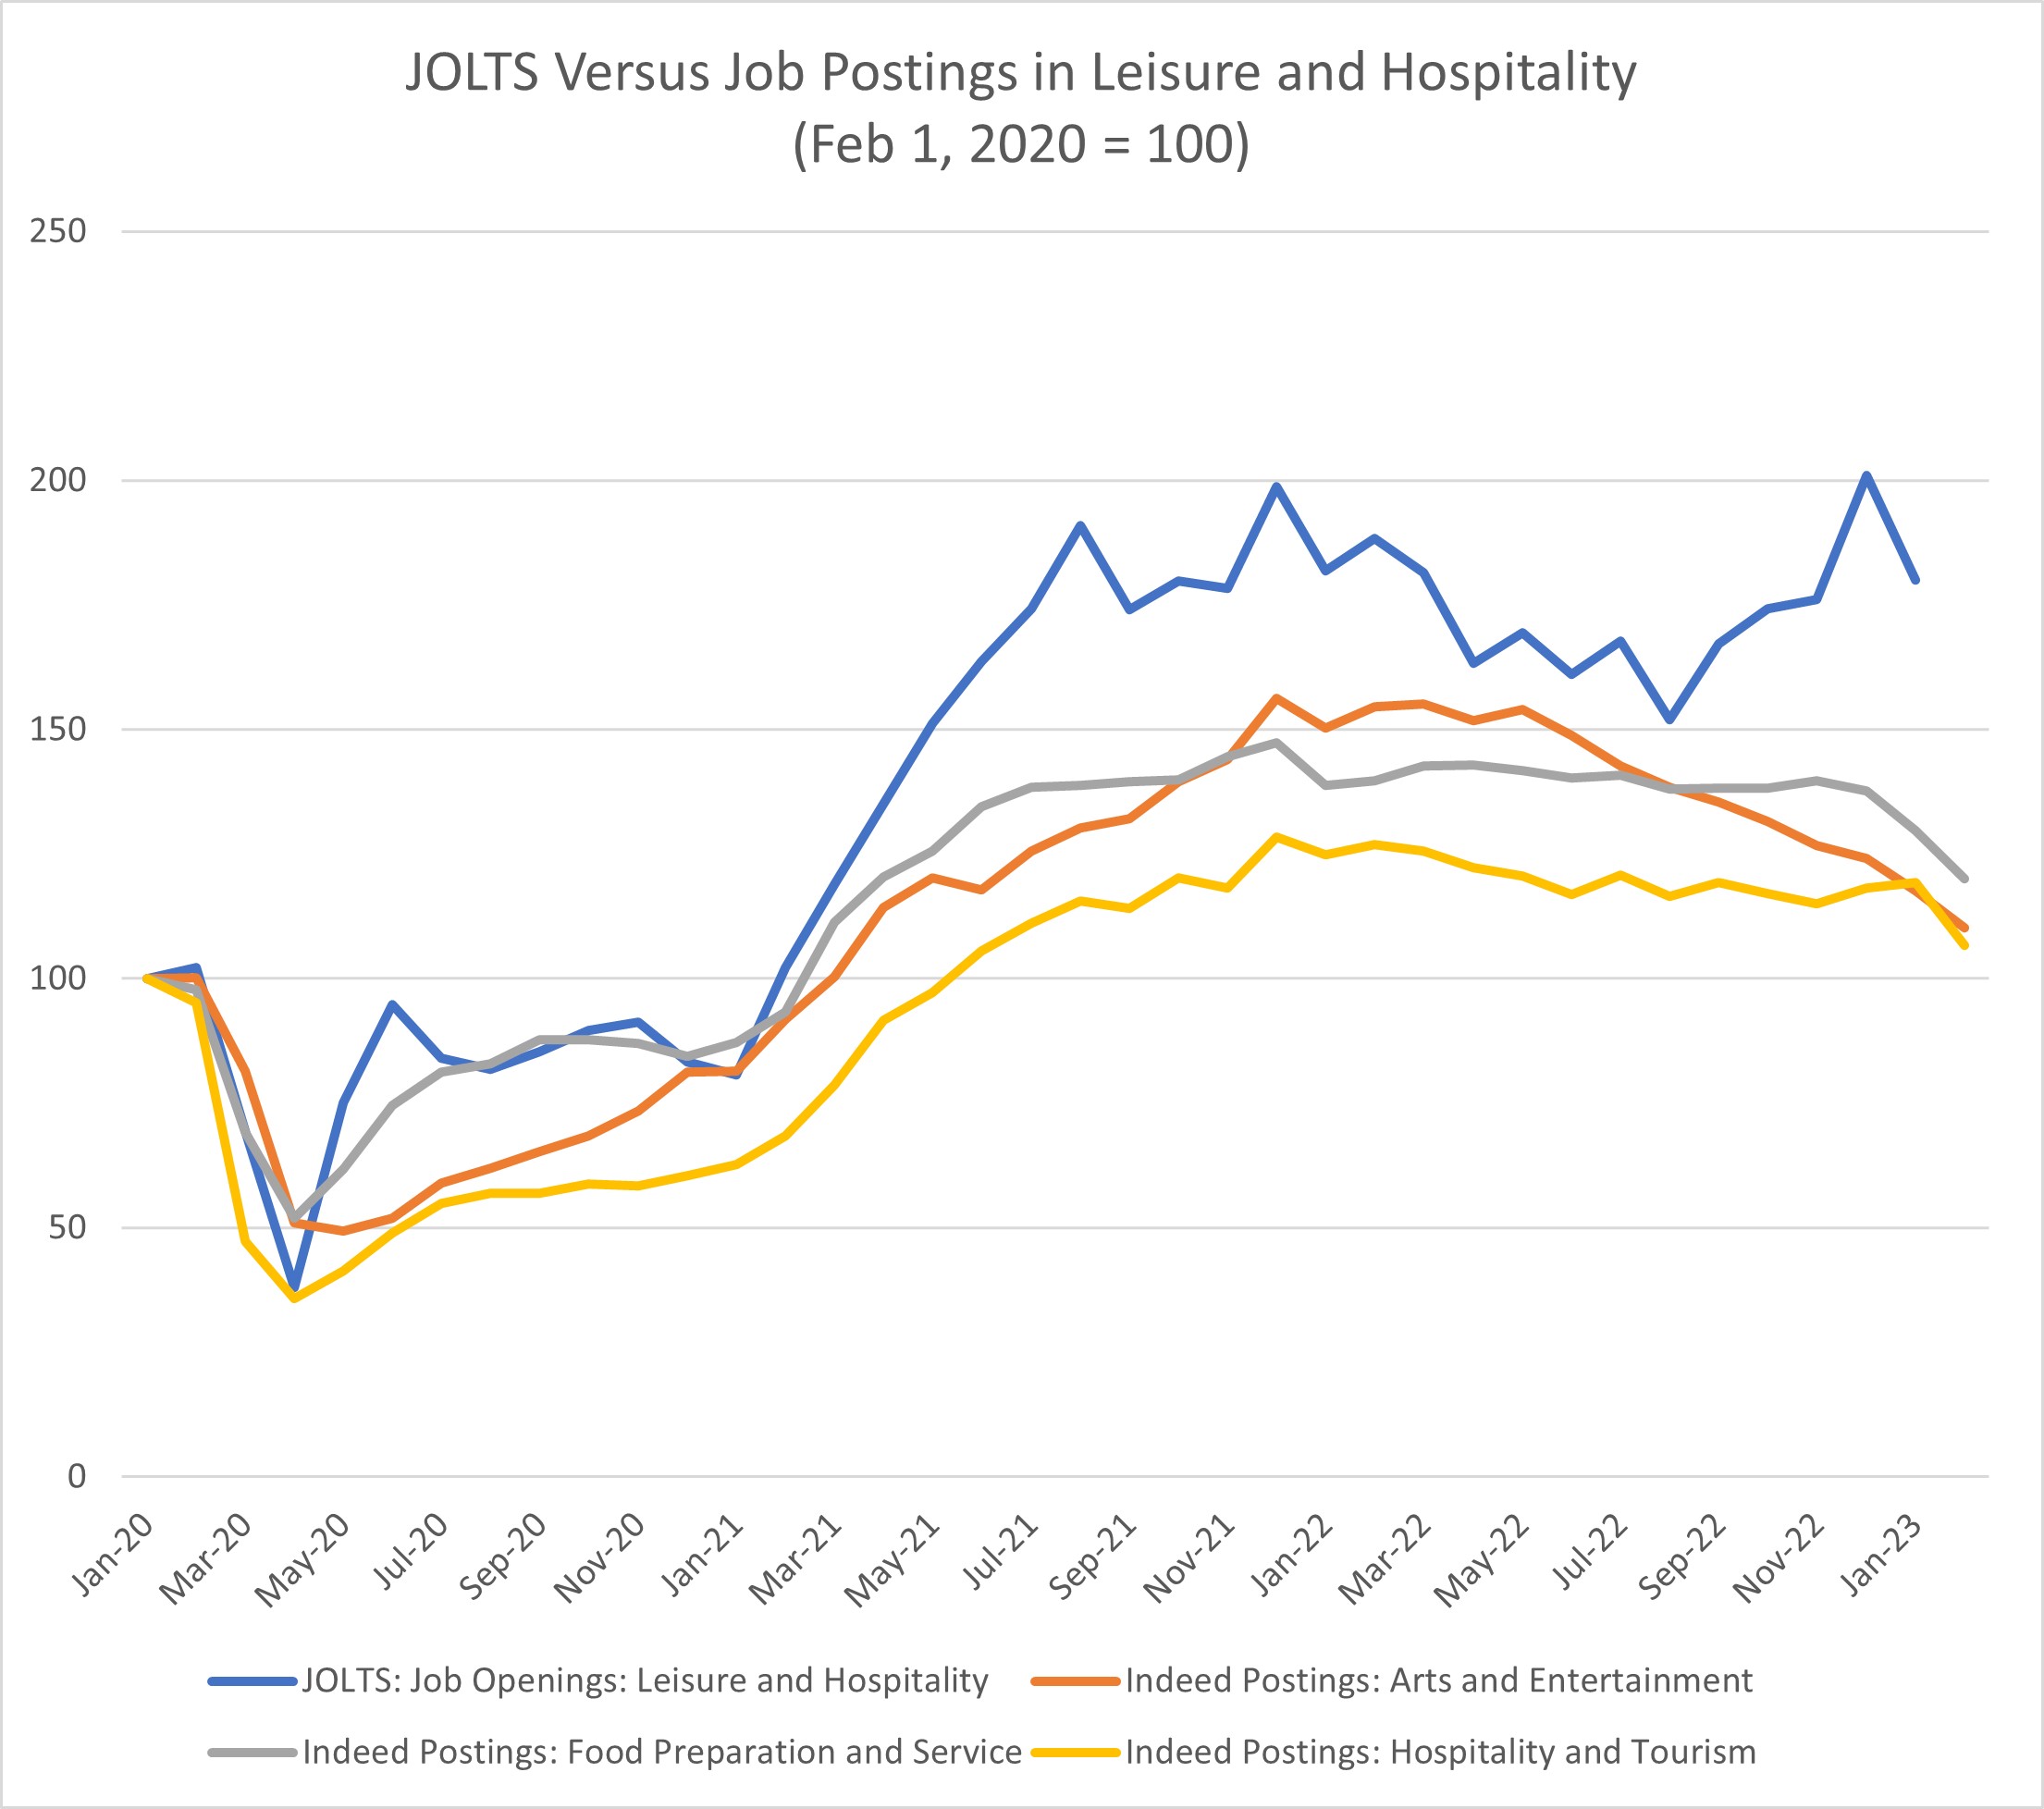
Furthermore, alternative high-frequency job postings data from Indeed are picking up a decline in L&H job postings that has yet to be seen in the official JOLTS series, as shown in Figure 5 below. We could be seeing a shift in hiring sentiment in L&H: Employers could be becoming more cautious as they revise their expectations about the overall economy or, following a year of labor shortages, may have increased automation or changed business practices toward less labor-intensive models.
Views expressed in this article are those of the author and not necessarily those of the Federal Reserve Bank of Richmond or the Federal Reserve System.


