How Do Rate Cuts Affect Housing Affordability?
Housing affordability has deteriorated since the start of the pandemic. Would Fed rate cuts improve the outlook for homebuyers? In this post, I examine the potential connection between policy rates and housing affordability.
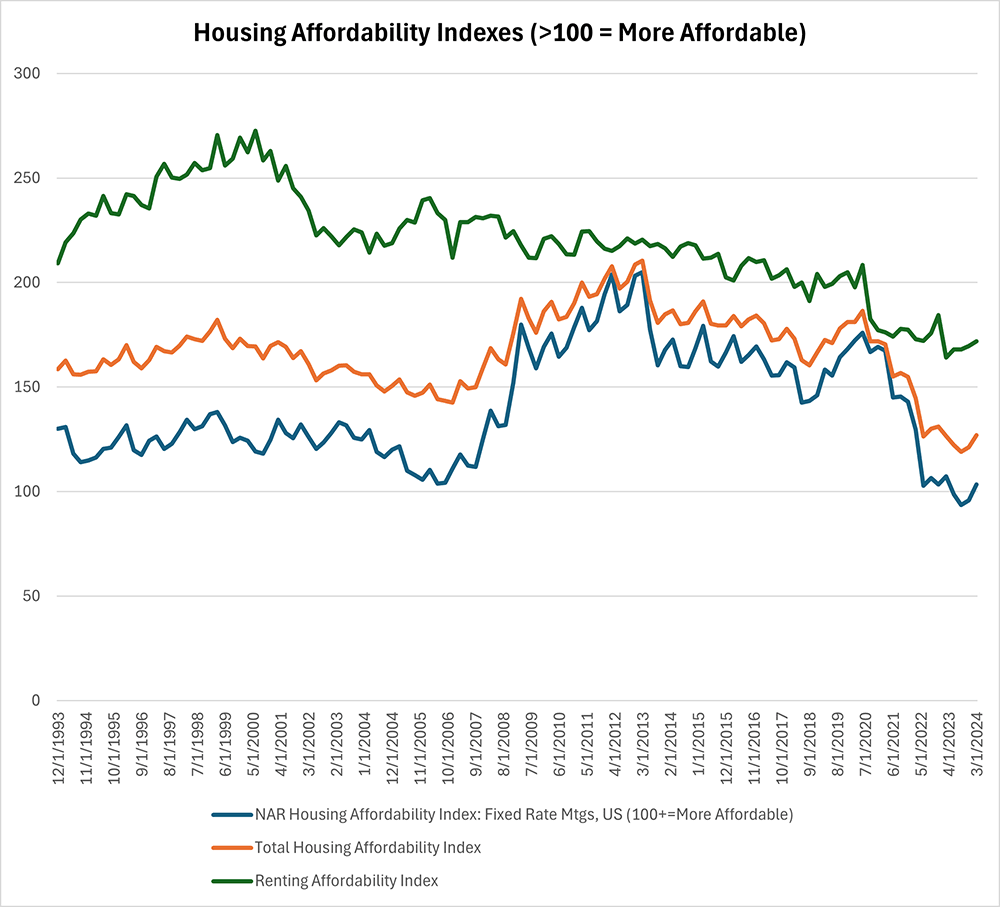
First, we'll look at how housing affordability has changed in the past few years. One measurement we can use is the National Association of Realtors' (NAR) Housing Affordability Index (HAI), in which higher scores indicate more affordable housing. The HAI has averaged 131.0 since 2020, compared to an average of 169.9 in the decade before the pandemic.
Similarly, although renting remains more affordable than owning, affordability for renters has also deteriorated: An index of rental affordability constructed to match the HAI1 has fallen by more than 15 percent since 2020, averaging 177.6 compared to an average of 211.4 the decade before the pandemic. Figure 1 below shows these indexes, along with their average (which I refer to as the Total HAI), weighted by the share of owner-occupied versus renter-occupied housing units.
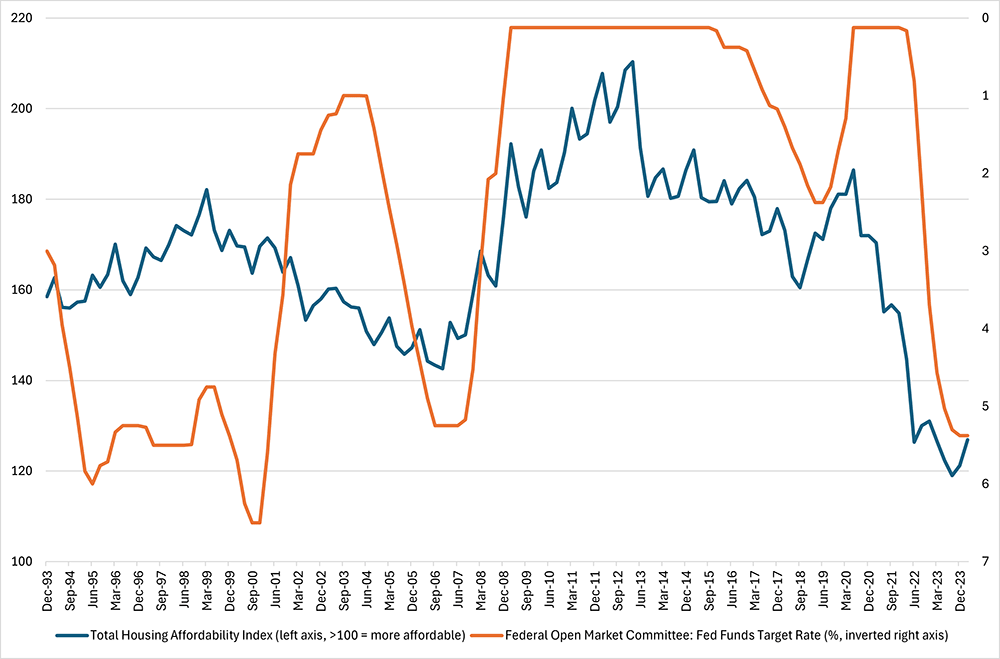
Our next step is to examine potential connections between policy rates and housing affordability. In Figure 2 below, we display the Total HAI alongside the fed funds rate. There appears to be a link between the two, with the correlation between the two series equal to -0.5 from the fourth quarter of 1993 through the first quarter of 2024, indicating that higher policy rates are associated with less affordable housing.
While Figure 2 suggests that affordability would increase as rates fall, the relationship between the two series is more complicated in the near term. We start by looking at the calculation of the HAI. The homebuying component of the Total HAI is based on the median price of existing single-family homes sold and assumes homebuyers take out mortgages with an 80 percent loan-to-value ratio, using the average effective mortgage rate on loans closed. The HAI compares the monthly payments for such a mortgage against median monthly household income. The HAI is equal to 100 times the ratio of median family income to qualifying income (the income needed to qualify for a loan with the described characteristics). Qualifying income is assumed to be four times the monthly mortgage payment. In other words, the mortgage payment should not exceed 25 percent of monthly household income.
All else equal, lower interest rates would lower the monthly mortgage payment and lead to a higher value of the HAI and greater affordability. That said, it's important to keep in mind that not all changes in the fed funds rate guarantee a move in the same direction in mortgage rates. Furthermore, with lower interest rates, homebuying demand would also rise in the near term, leading to an increase in home prices. Higher home prices raise the level of income needed to qualify for a mortgage, lowering the HAI.
Prior research has shown that monetary policy shocks can have substantial impacts on housing demand. In a 2019 paper, Daniel Dias and João Duarte find that, in data from 1983 through 2017, contractionary monetary policy shocks (such as unexpectedly higher interest rates) are associated with lower homeownership rates and increased housing rents as people are driven from homebuying toward the rental market. In a FEDS Note published in May, Dias and Duarte show that monetary policy shocks can account for about 30 percent of variation in the U.S. homeownership rate as well as 30 percent of long-run variation in house price growth, demonstrating that monetary policy shocks are as important for homeownership as they are for CPI inflation.
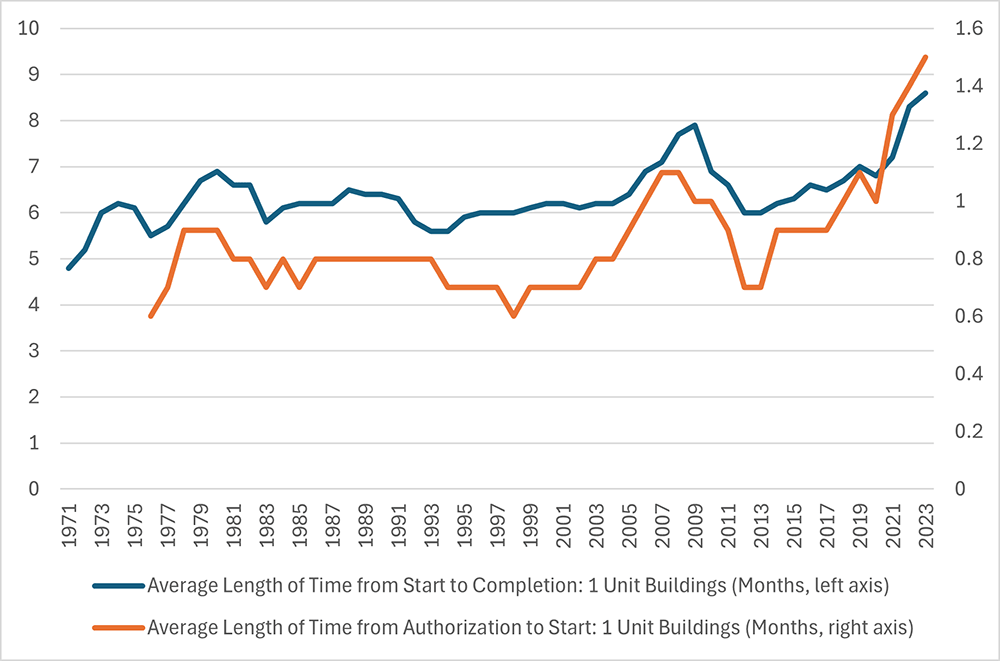
It is likely that demand would rise relative to supply in response to lower rates in the near term because of the time needed to deliver housing supply to the market. While homebuyers might be quick to respond to lower mortgage rates, it takes time to build new housing supply. Figure 3 below shows the average length of time (in months) that a new housing project takes to get from the permit stage to the start of construction, as well as the average length of time needed to get from start to completion. Both series have reached a record high in data that extend through the 1970s.
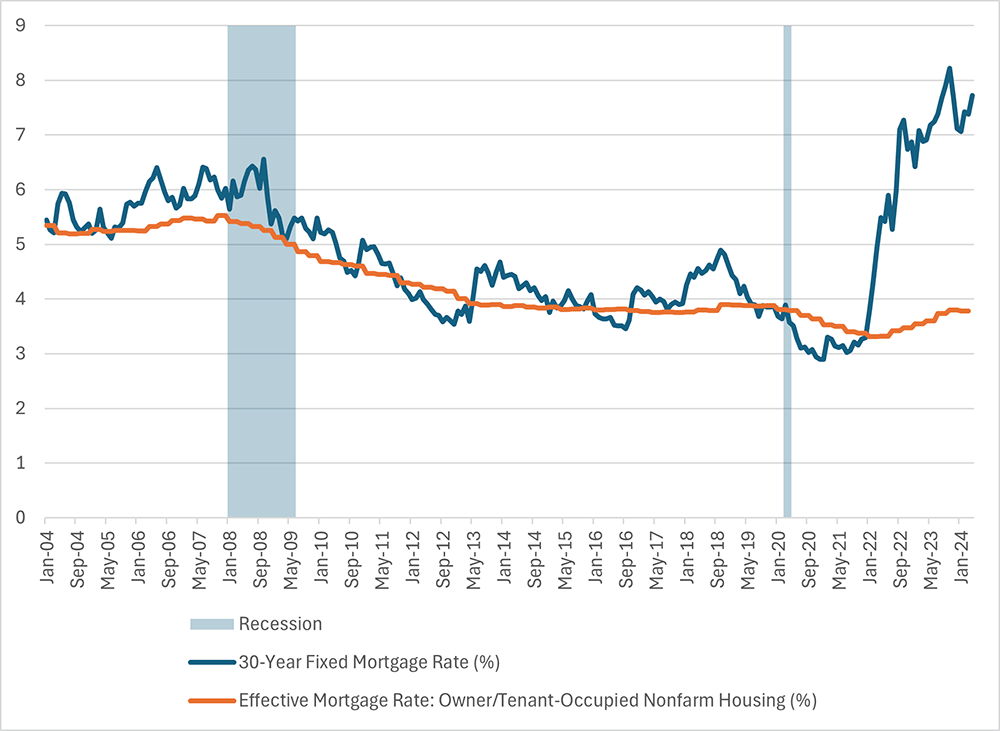
Meanwhile, the inventory of existing homes for sale has remained below pre-pandemic levels: According to the NAR, months' supply of existing homes was 3.5 in April 2024, compared to a 2015-2019 average of 4.2 months. Existing homeowners — particularly those who secured low mortgage rates before the pandemic — have been reluctant to move and trade in their low-rate mortgages for the higher rates prevailing today, making them "locked-in" to low mortgage rates.
Figure 4 below shows that the effective mortgage rate being paid by homeowners was 3.8 percent in March 2024, compared to the 7.4 percent average rate on new mortgages that month. In the near term, rate cuts (which tend to occur in quarter-point increments) would do little to dissolve that lock-in effect. Even if these homeowners were to put their properties up for sale, they would still need someplace to live, becoming buyers themselves and perhaps offsetting their own positive impact on supply.
Considering these competing effects, how should we interpret the strong correlation between low rates and better affordability seen in Figure 1? As any good economics student knows, correlation is not causation. What looks like a strong relationship between the two variables could be a side effect of both monetary policy and housing prices responding to overall economic conditions, for instance.
To see the causal effect of monetary policy on housing affordability, we (like Dias and Duarte) need to exploit monetary policy shocks: episodes where monetary policy movements are independent of changes in current and anticipated economic activity. Economists have studied various methods to identify such shocks, including in the 2004 paper, "A New Measure of Monetary Shocks: Derivation and Implications" by Christina Romer and David Romer and the 2020 paper, "Deconstructing Monetary Policy Surprises — The Role of Information Shocks" by Marek Jarociński and Peter Karadi.
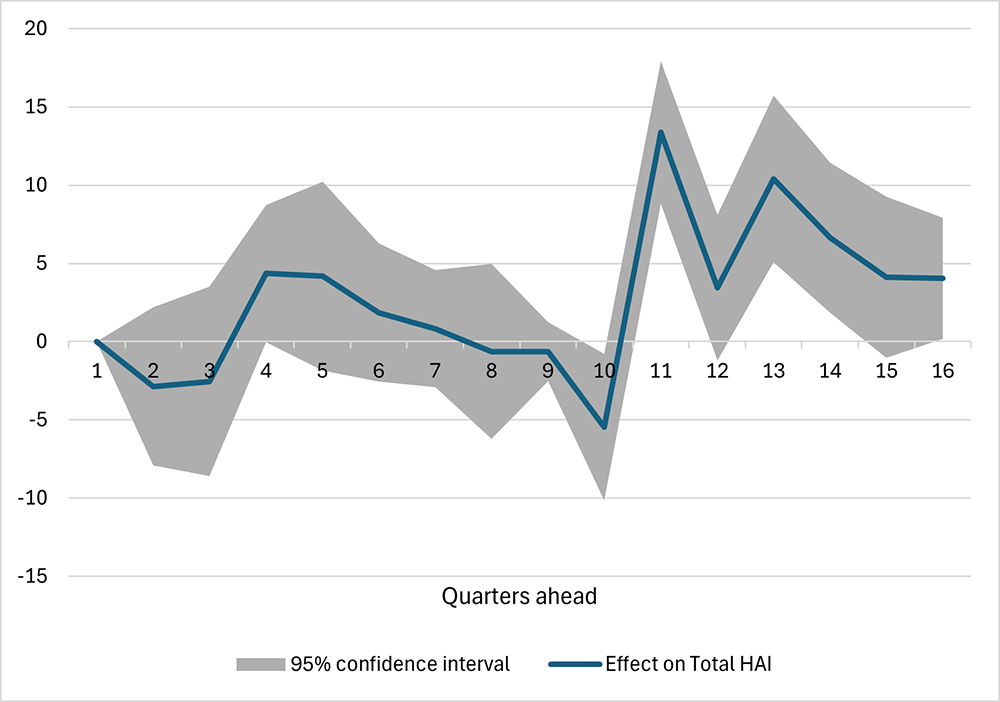
In Figure 5 below, I plot the response of the Total HAI to a 1 percent monetary policy shock as measured by the 2004 Romer and Romer paper and updated by the 2020 paper, "Financial Dampening" by Johannes Wieland and Mu-Jeung Yang. The figure shows an impulse response function estimated by local projections using quarterly data from the first quarter of 1993 through the fourth quarter of 2007.
The figure shows that, within the first 2 1/2 years after a monetary policy shock, there is no statistically significant effect on total housing affordability. This suggests that trying to unconventionally leverage the Fed's interest rate policy to improve near-term housing affordability would likely be ineffective. Instead, advocates for housing affordability should be rooting for the Fed to be successful in its objectives of broad price stability and full employment, the underlying conditions that support the higher incomes, stable pricing environment and lower interest rates that make housing more affordable.
I constructed the rent affordability measure by first computing the affordable income threshold, or the level of income for which the median asking rent on vacant for-rent housing units nationwide (as reported by the Census Bureau) represents exactly 30 percent of annual income. Then, I set the rent affordability index equal to 100 times the ratio of median family income to the affordable income threshold.
Views expressed in this article are those of the author and not necessarily those of the Federal Reserve Bank of Richmond or the Federal Reserve System.


