How Older Workers Got Their Groove Back
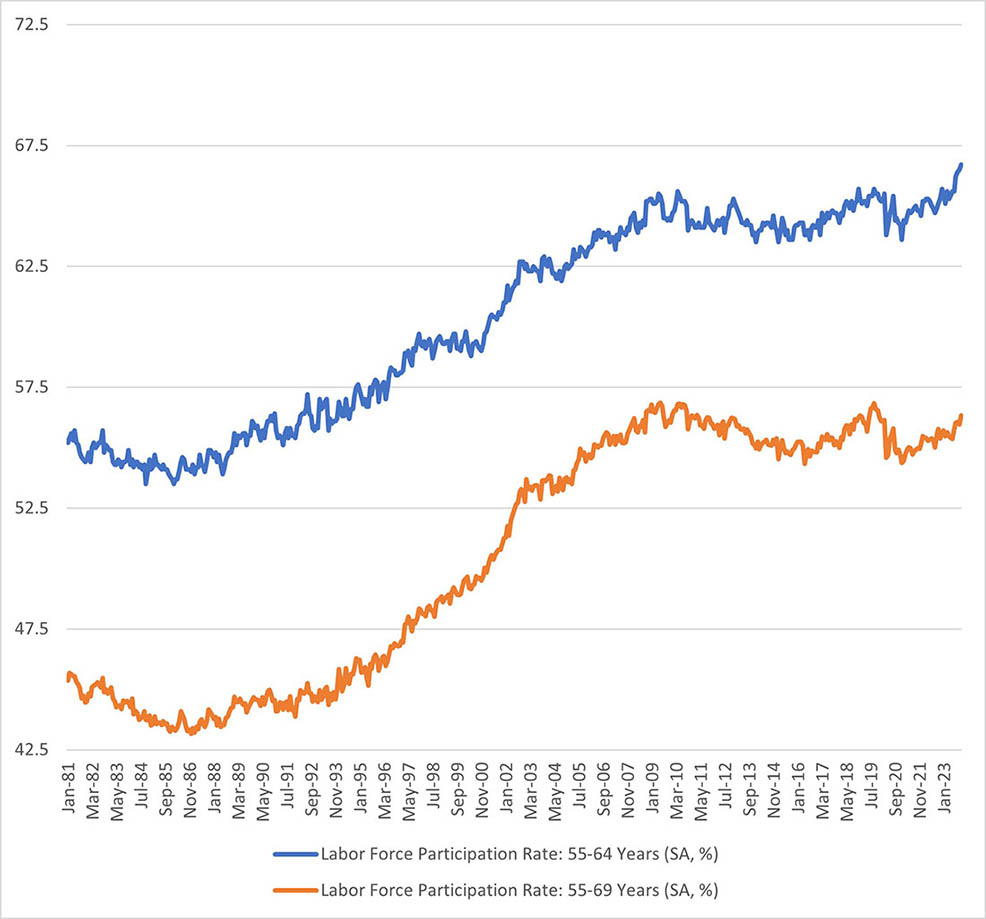
Happy New Year! We kick off 2024 with an interesting fact from the labor market: Labor force participation among older workers is on the rise. Figure 1 below shows that seasonally adjusted labor force participation for workers aged 55 to 64 rose to 66.7 percent in November, which is a record high in data going back to 1948. For workers aged 55 to 69, labor force participation rose to 56.3 percent in November. While not a record high, this was the highest mark since November 2019. (Note: In December's employment report released after this post was written, the labor force participation rate for workers aged 55 to 64 dropped to 66.2 percent, and labor force participation rate for workers aged 55 to 69 dropped to 55.5 percent.)
This increase in labor supply from older workers should be welcomed by businesses — who still report challenges in hiring skilled workers — and it could help reduce inflation pressures stemming from labor market tightness.
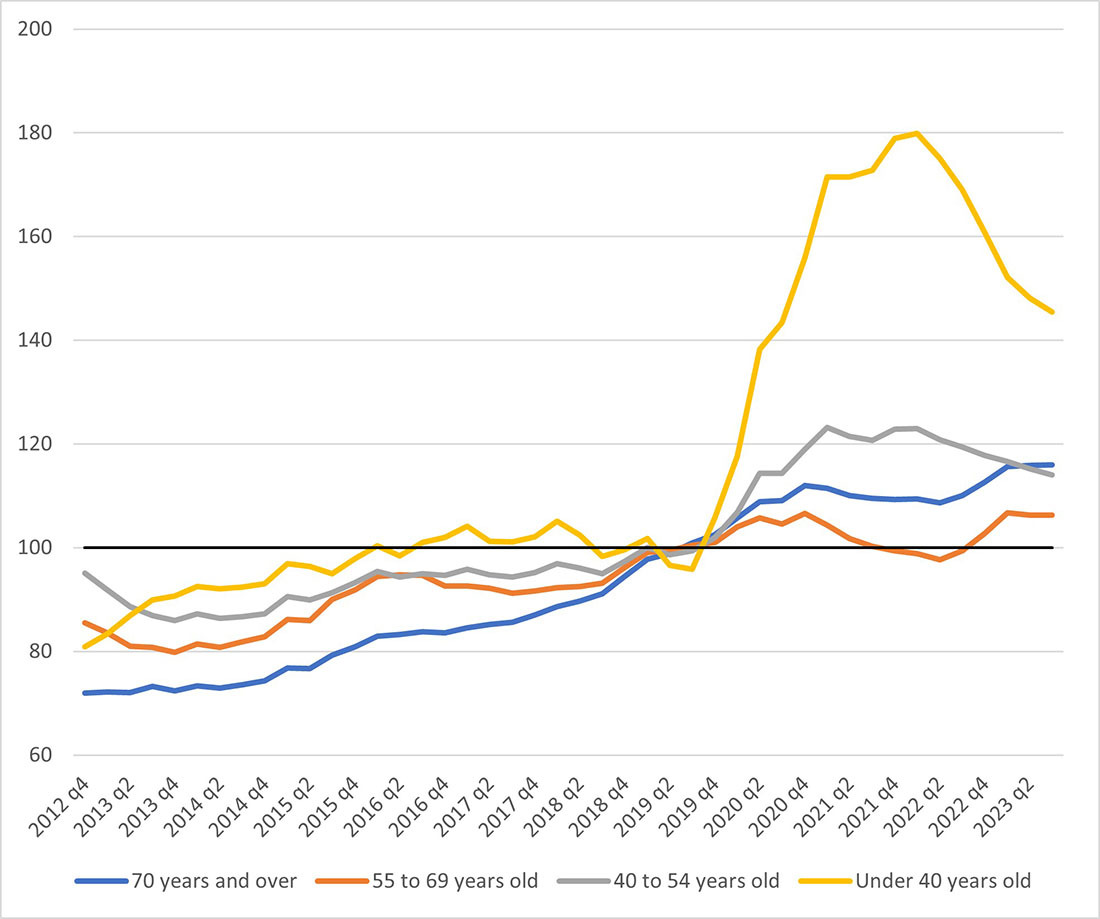
What might explain the return of older workers from the sidelines? One reason older workers have increased their participation rates may be increased concern about their financial cushions. Data from the Distributional Financial Accounts published by the Federal Reserve Board of Governors shows that real liquid assets held by households in the 55 to 69 age group have essentially flatlined over the past three years and are closer to their pre-pandemic levels compared to other age groups. As shown in Figure 2 below, as of the third quarter of 2023, real liquid assets held by households aged 55 to 69 were 6.3 percent higher than 2019 levels. This increase lagged considerably behind other age groups: For the same period, real liquid assets were 16.0 percent higher for households 70 years and older, 14.0 percent higher for households between 40 and 54 and a whopping 45.5 percent higher for households under 40.
Greater anxiety among older workers about their financial situations can also be seen in some surveys of household sentiment. The University of Michigan's Surveys of Consumers asks respondents the following question:
"Now looking ahead—do you think that a year from now you (and your family living there) will be better off financially, or worse off, or just about the same as now?"
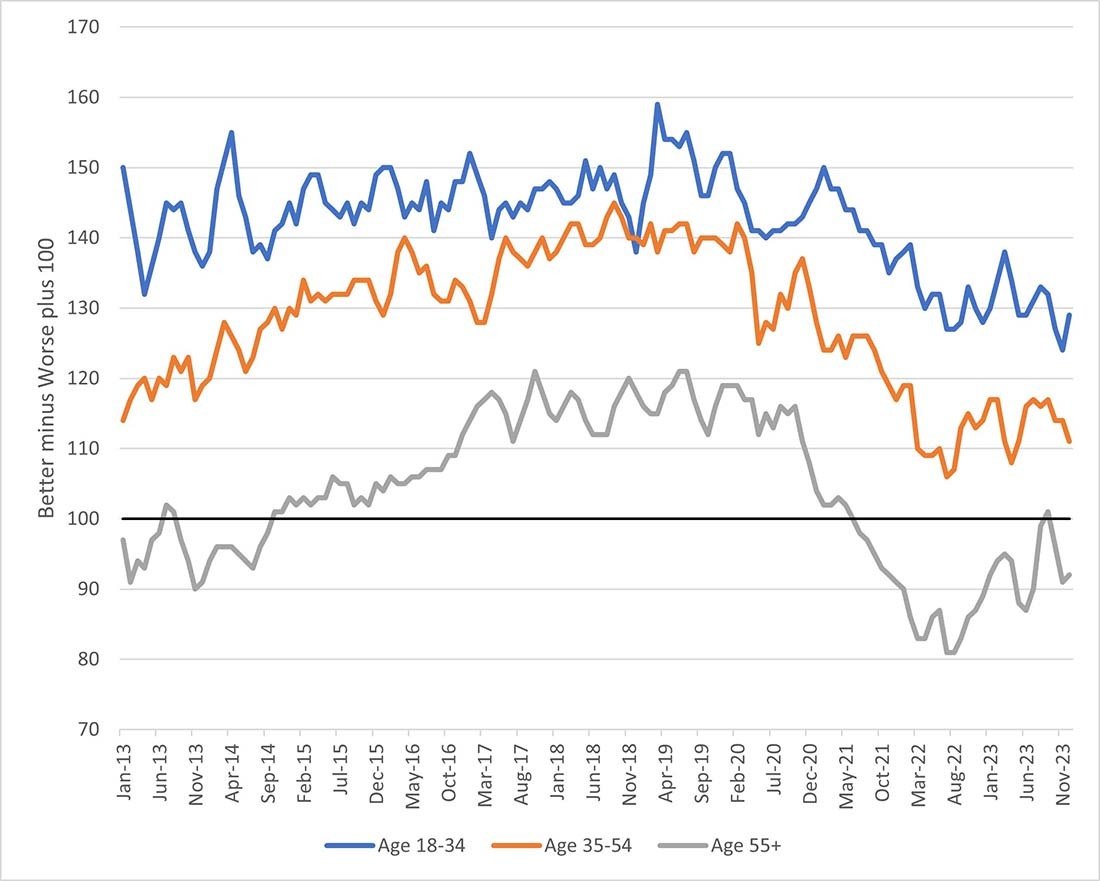
Figure 3 below shows the net percentage of respondents by age group who answered positively to this question. The responses are normalized so that a score of 100 indicates that respondents are evenly divided between those who expect to be better off and those who expect to be worse off a year from now. Older respondents seem to always be more pessimistic than younger respondents about their short-run financial situation. However, in the five years before the pandemic, they were on net optimistic about changes in their financial situation in the year ahead.
Since 2021, however, respondents aged 55 and older have on net expected their financial situations to worsen over the next year (with the exception of a single month in September 2023). In contrast, although their optimism has declined since the start of the pandemic, respondents in the 18 to 34 and 35 to 54 age brackets have remained, on net, optimistic about changes in their financial situations over the coming year. Among older workers who are now net pessimists, concerns about the sustainability of their finances may be driving some back to the labor market in search of additional income.
Views expressed in this article are those of the author and not necessarily those of the Federal Reserve Bank of Richmond or the Federal Reserve System.


