Searching for Signals in a Stock Market Surge
Macro Minute
June 18, 2024
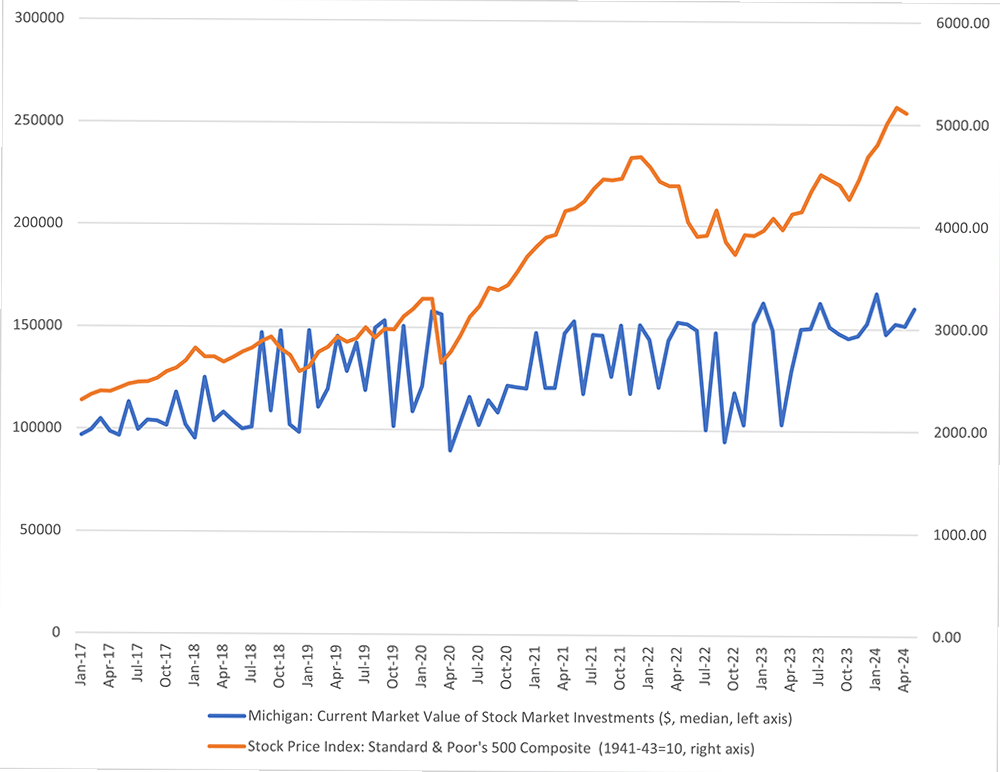
Stock prices rose higher in the spring, supporting household sentiment. As seen in Figure 1 below, the May 2024 Surveys of Consumers conducted by the University of Michigan found that the current market value of the median stock-owning household's investments has jumped to a record high $160,124. (It should be noted that, as also seen in the figure, these responses are very volatile from month to month.) Recent performance of the S&P 500 Index has also been strong: At the end of May, the index was up 26.2 percent year over year.
What might this recent rise in equity values mean for the economy? I look at three possible implications:
- A consumption-supporting wealth effect for households
- Risks to financial markets from a stock market bubble
- Possibilities of strong future output growth
Rising stock prices could have made households feel richer and increased their willingness to spend, known as the wealth effect. This may be one factor that has kept consumption growth in positive year-over-year territory following the pandemic recession.
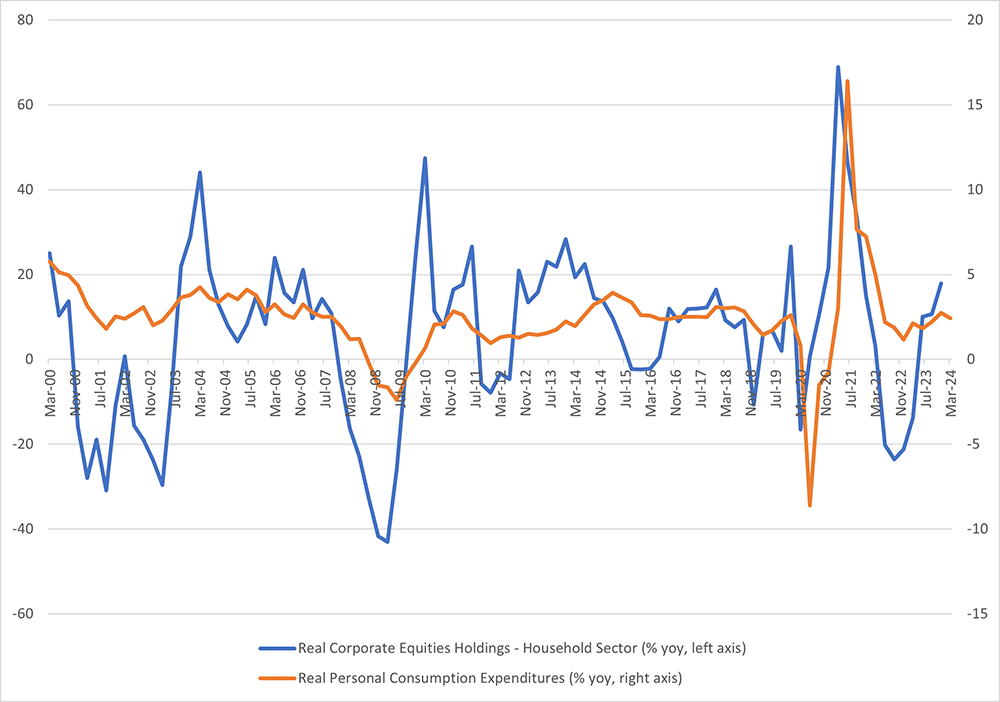
Figure 2 below plots year-over-year growth in inflation-adjusted corporate equity holdings for households (the blue line and left axis, from the Financial Accounts of the United States produced by the Board of Governors and deflated by the PCE price index) against year-over-year real personal consumption expenditure growth (the orange line and right axis). There is a modest positive correlation of 0.38 between the two series, suggestive of a wealth effect.
However, the stock market could also be overvalued relative to fundamentals, posing a risk to financial stability. As noted in the Board of Governors' April 2024 Financial Stability Report, "Valuation pressures arise when asset prices are high relative to economic fundamentals or historical norms. ... Elevated valuation pressures may increase the possibility of outsized drops in asset prices."
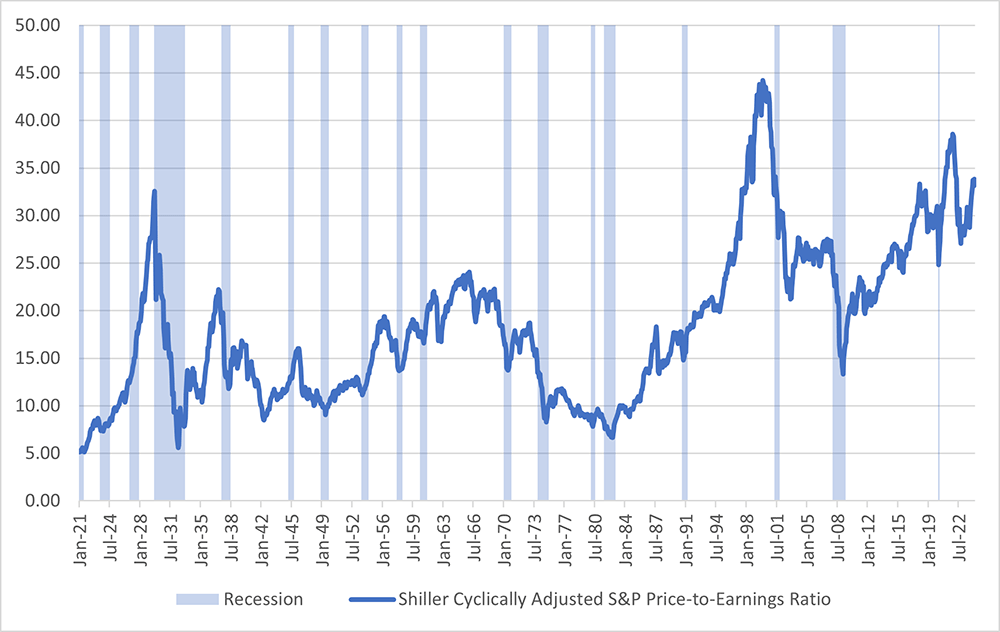
The report further notes that equity price-to-earnings ratios have moved to the high end of their historical range. This can be seen in Figure 3 below, which plots the S&P 500 cyclically adjusted price-to-earnings ratio (CAPE), a measure of stock prices relative to the earnings of the companies in the index, adjusted for economic conditions such as inflation and longer-term interest rates. The CAPE was 33.8 in May 2024, which was 1.9 standard deviations away from its long-run average of 18.3. (Data start in January 1921.)
Alternatively, elevated stock prices could be sending a positive message about future productivity growth. Research has pointed to a link between asset prices and productivity, with some papers studying the relationship between the two variables during the period of computer adoption in the 1990s.
For example, in their 2006 paper, "Stock Prices, News, and Economic Fluctuations," Paul Beaudry and Franck Portier show that news shocks about future technological opportunities can initially be visible in stock prices, followed by higher consumption, investment and hours worked, before finally manifesting in productivity growth a few years later. In their 2007 paper, "Stock Market Boom and the Productivity Gains of the 1990s," Urban Jermann and Vincenzo Quadrini build a model that explains the high output and employment growth, rapid labor productivity growth, and stock market boom that took place in the second half of the 1990s. Their model shows that expectations for future productivity growth can drive up the expected profits of firms and raise their market value, increasing demand for labor and shifting resources toward more productive firms, which leads to faster productivity growth.
Generative artificial intelligence (AI) may represent a form of general-purpose technological innovation which (like computers in the late 1990s) could lead to gains in productivity growth once the technology is widely adopted and integrated, or embodied, in the capital stock of firms. If so, we could eventually see an increase in trend labor productivity growth driven by this new technology.
For example, a Goldman Sachs report estimates that generative AI could raise annual U.S. labor productivity growth by nearly 1.5 percentage points over a 10-year period, while a Brookings Institution article by Martin Neil Baily, Erik Brynjolfsson, and Anton Korinek argues generative AI will have "tremendous positive productivity effects, both by increasing the level of productivity and by accelerating future productivity growth." Rich stock valuations today could reflect this optimistic scenario for productivity.
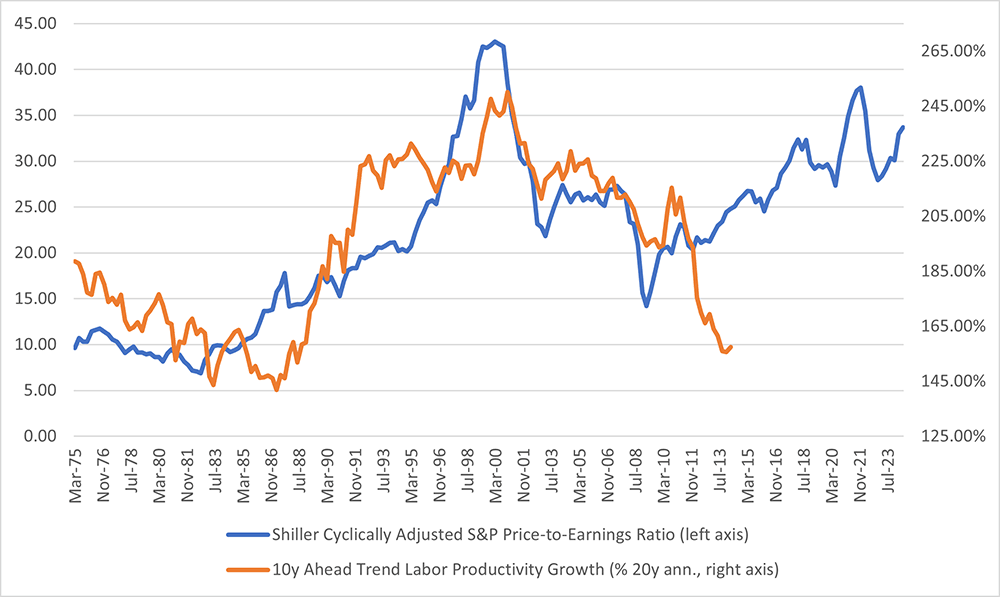
In Figure 4 below, the potential role of the stock market as a leading indicator for trend productivity growth is depicted by plotting today's cyclically adjusted price-to-earnings ratio, commonly referred to as CAPE, against future (10-year ahead) trend labor productivity growth (measured as the annualized growth rate of real output per hour over 20 years). CAPE is represented by the blue line and corresponds to the left axis, while future trend labor productivity growth is represented by the orange line and corresponds to the right axis. From the first quarter of 1975 through the first quarter of 2014, the correlation between the two series has been 0.79, indicating a positive relationship.
Views expressed in this article are those of the author and not necessarily those of the Federal Reserve Bank of Richmond or the Federal Reserve System.
Contact Us