Answers Don't Come Easy
Macro Minute
August 26, 2025
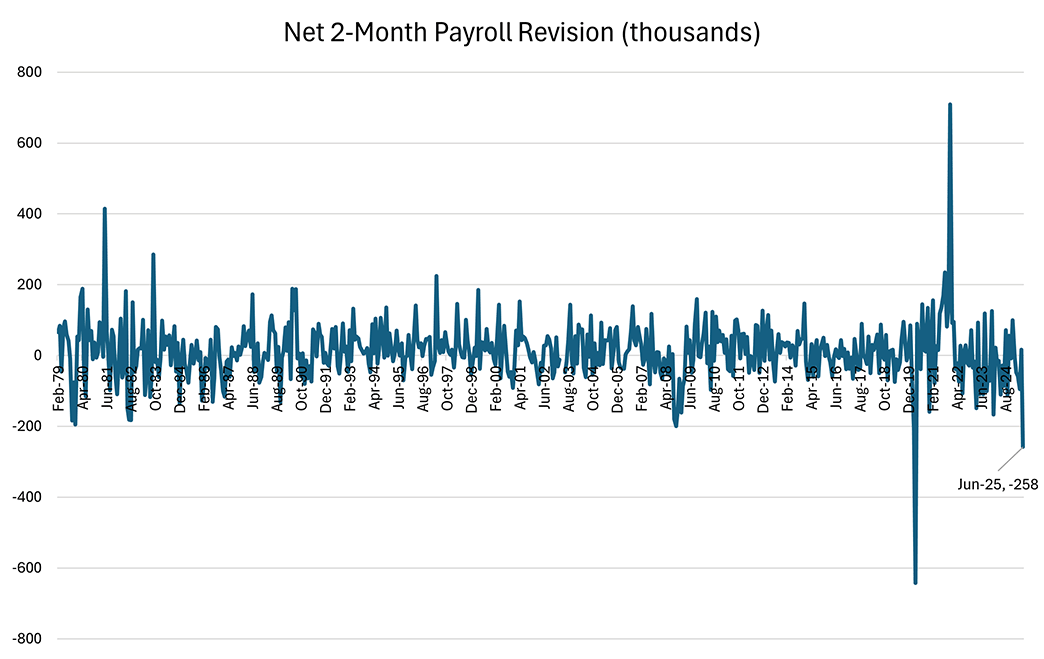
As we noted a couple weeks ago, July's nonfarm payroll report from the Bureau of Labor Statistics featured a large revision to the prior two months' estimates of payroll growth. May's growth in total nonfarm payroll employment was revised down by 125,000 (from 144,000 to 19,000), while the growth for June was revised down by 133,000 (from 147,000 to 14,000). As shown in Figure 1 below, the combined downward revision of 258,000 was the largest (outside of the pandemic-affected drop in 2020) for a two-month span since at least 1978.
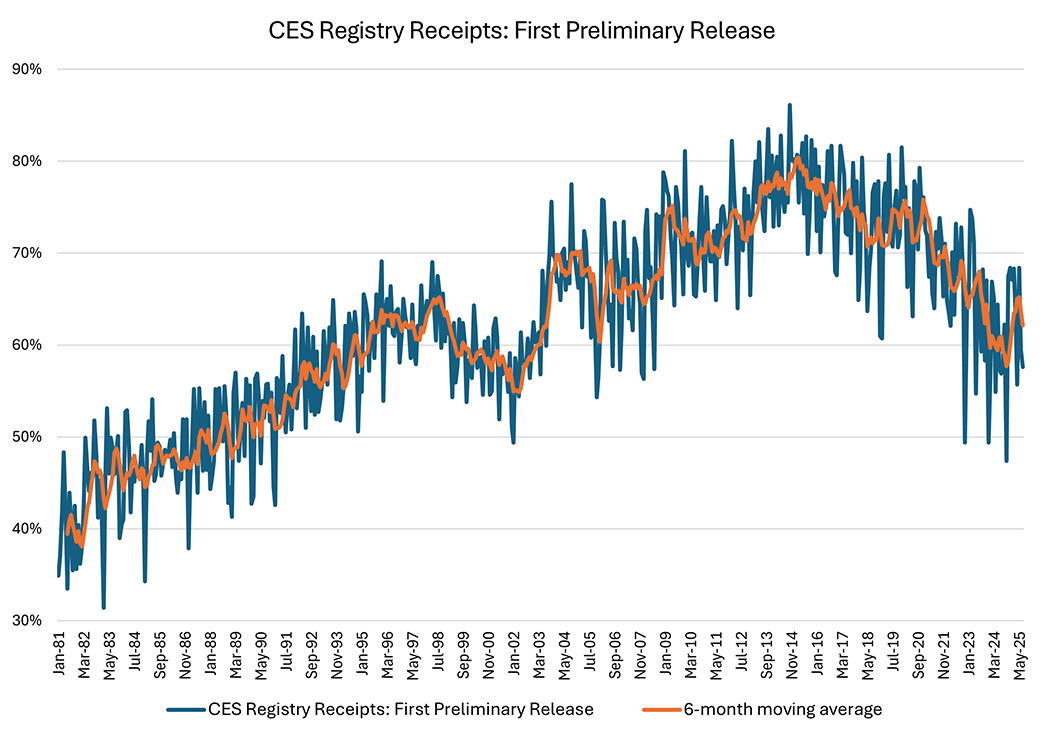
Many have conjectured that declining response rates to the Current Employment Statistics survey (CES) — which is the source of the monthly nonfarm payroll estimates — were responsible for the outsized data revision. In support of that view, CES collection rates — the percent of reports received for the monthly estimate as a share of total actively reporting sample units — for the first estimate of monthly payrolls have declined since their peak in the mid-2010s, as shown in Figure 2 below.
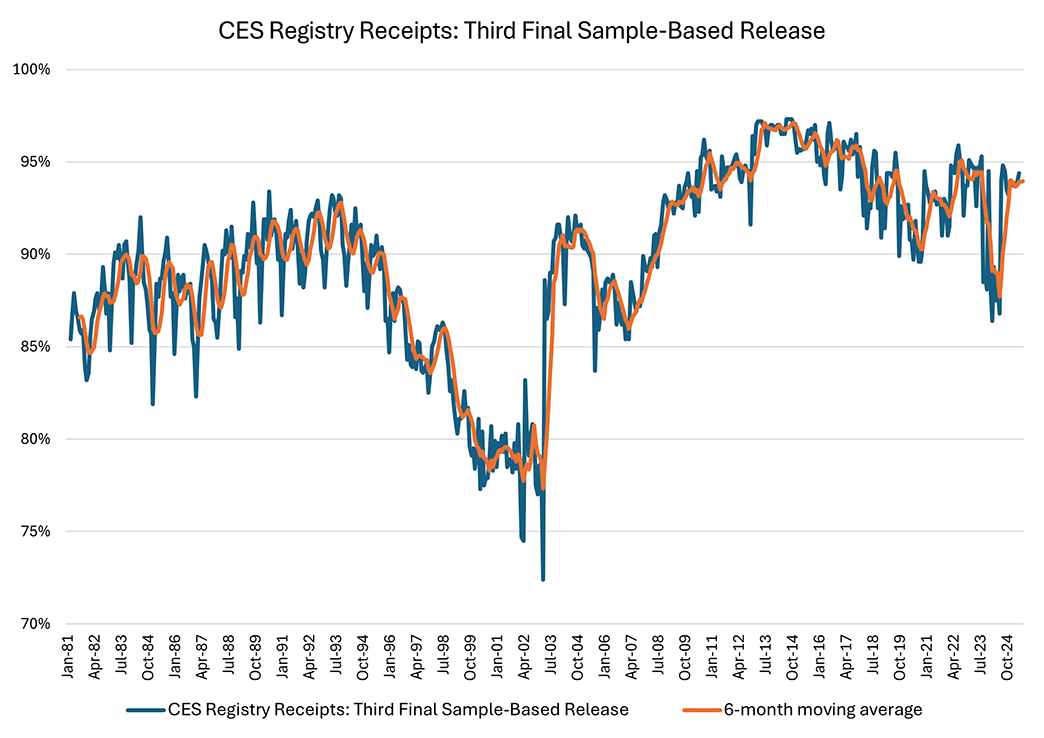
However, for each monthly payroll estimate, data from businesses are collected over two months. The BLS updates its estimate of monthly payroll growth as additional information comes in, which is why initial estimates of monthly payroll growth are revised over the following two months. By the third estimate, CES collection rates are much higher, as shown in Figure 3 below. Outside of a decline during the pandemic, recent collection rates for the third estimate of monthly payrolls are similar to their levels during the previous decade, with close to 95 percent of active units responding.
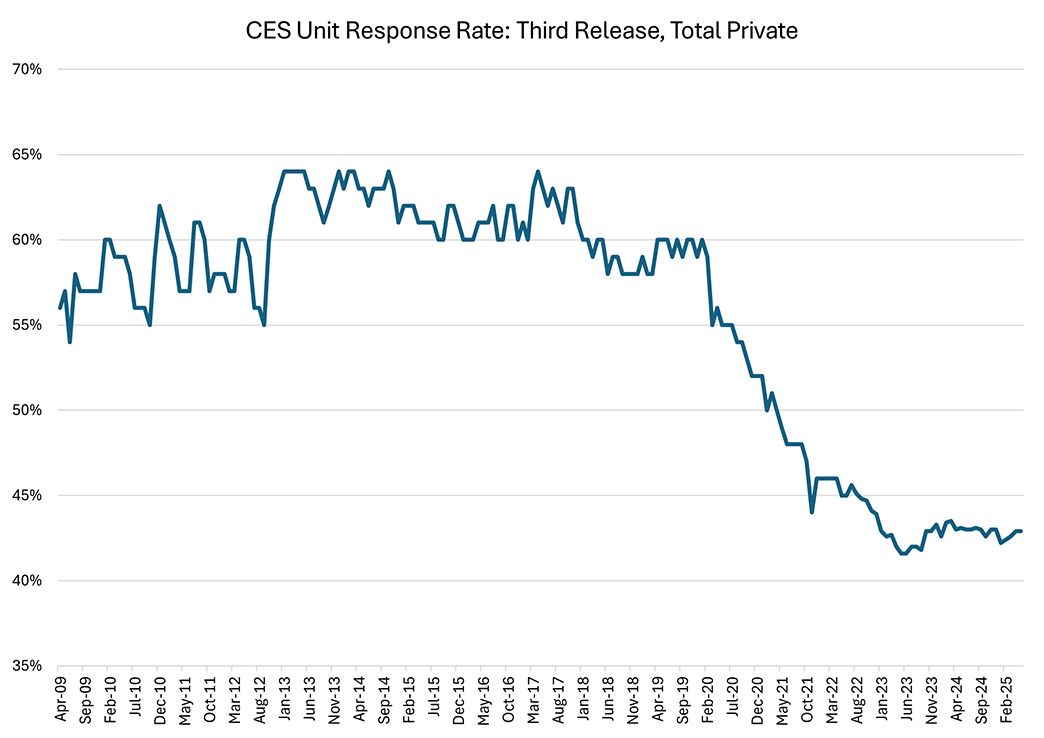
Does this mean that fears about declining response rates are overblown? Unfortunately not. In addition to collection rates, the BLS publishes response rates to the CES for private sector establishments. The main difference between the two rates is that collection rates are expressed as a share of actively reporting units, while response rates include units that are inactive, including sampled businesses that refuse to respond (as the CES is a voluntary survey). Businesses falling into the refusals category may actively refuse to respond to the survey or be delinquent in responding by at least a year and unresponsive to attempts by the BLS to contact them.
Figure 4 below plots the response rate for private sector businesses, showing a decline of roughly 20 percentage points since the early 2010s. (Note that this series begins in 2009, unlike the collection rate series which starts in 1981.) The decline in response rates appears to have started during the COVID-19 pandemic and has remained low, suggesting that more businesses are refusing to respond to the CES or have become long-term delinquents (delinquent by more than six months).
Declining response rates represent a risk to the quality and reliability of survey-based economic data, which are a key input to researchers and decision-makers across private sector businesses, the broader public, and the Federal Reserve.
Note: Macro Minute will be away due to the Labor Day holiday followed by the Federal Reserve's blackout period on monetary policy communications in conjunction with each regularly scheduled meeting of the Federal Open Market Committee, or FOMC. Macro Minute will return Sept. 23.
Views expressed in this article are those of the author and not necessarily those of the Federal Reserve Bank of Richmond or the Federal Reserve System.
Contact Us