Female-Dominated Industries Driving Payroll Growth
Macro Minute
July 1, 2025
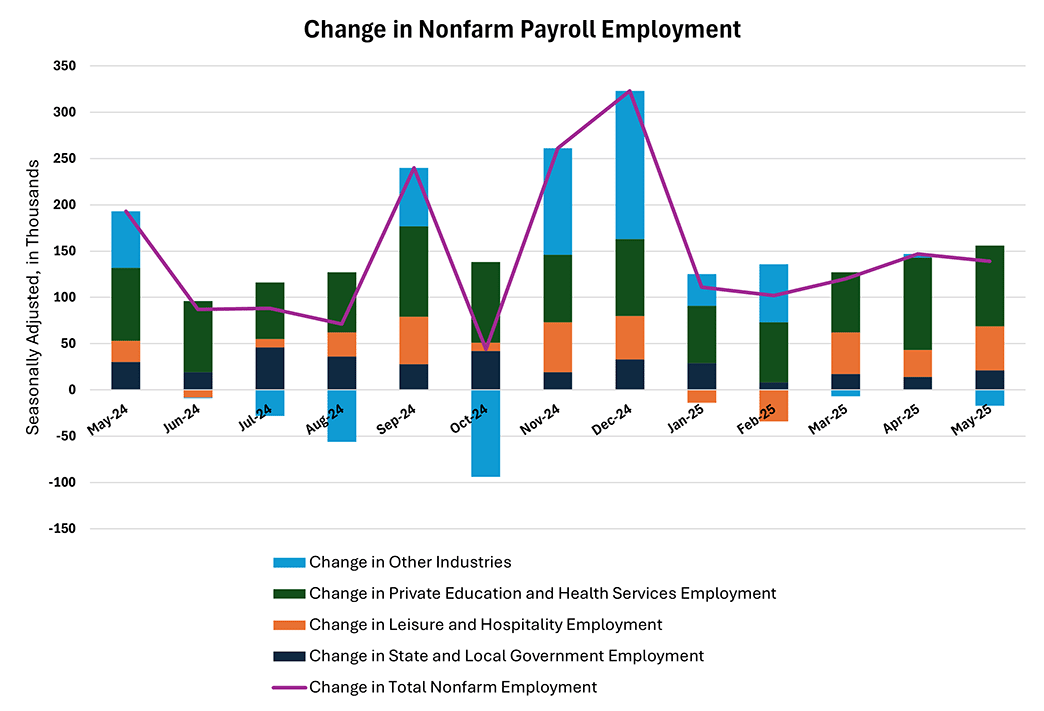
May's nonfarm payroll growth of 139,000 was driven once again by hiring in the private education and health services, leisure and hospitality, and state and local government industries. As shown in Figure 1 below, these three industries have made up the bulk of monthly nonfarm payroll growth for much of the past 12 months. In May, these three industries accounted for 112 percent of the monthly change in nonfarm payrolls, with other industries combining to subtract from the monthly jobs gain.
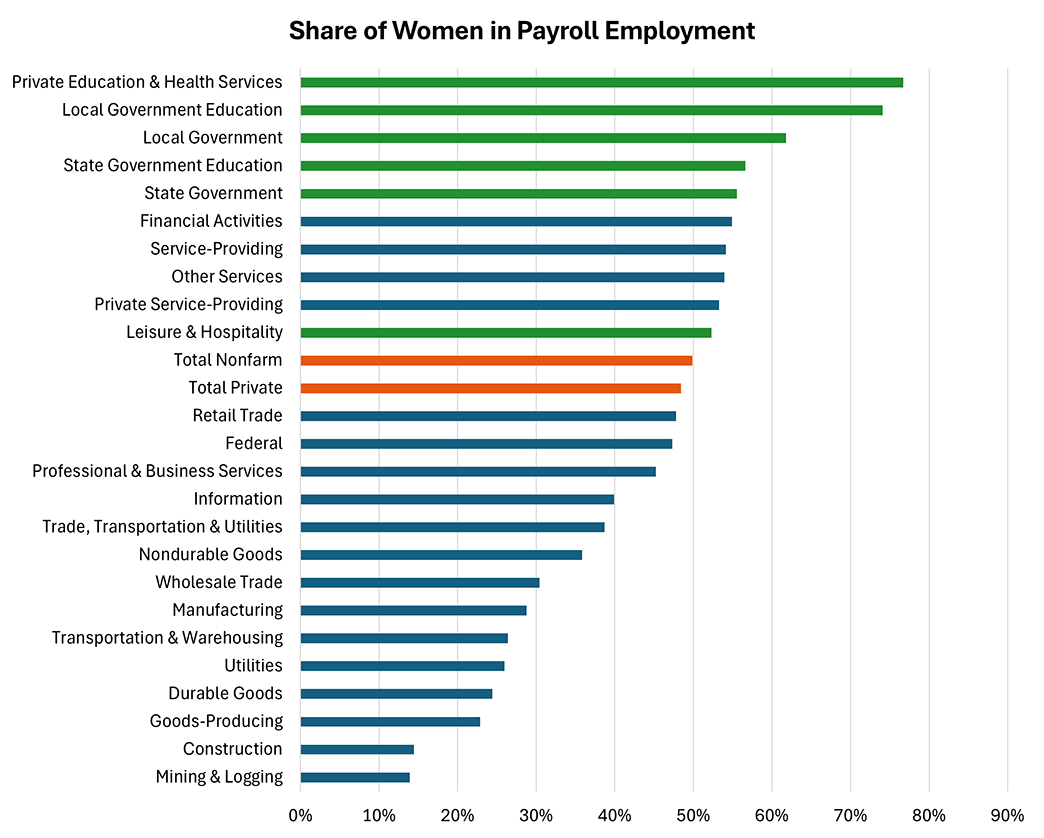
Aside from being an engine of recent U.S. job growth, these three industries share another common feature: They employ relatively more women than the national average. Figure 2 below shows the share of women in payrolls across different industries, with the three aforementioned industries in green and the total nonfarm payroll and total private sector payroll shares in orange. The education and health services industry tops the list, with women making up 76.7 percent of payroll employment compared to the total private sector share of 48.4 percent.
The gender skew of these industries — combined with their role as the primary driver of recent jobs growth — may have implications for new job seekers. In particular, younger job seekers (ages 16-24) have been experiencing more challenges finding employment compared to the overall population. The unemployment rate for ages 16-24 was 9.7 percent in May compared to an overall unemployment rate of 4.2 percent, a gap of 5.5 percentage points compared to a median monthly gap of 4.9 percentage points since 2015. Since April 2023, when the overall unemployment rate reached a low of 3.4 percent, the unemployment rate for ages 16-24 has risen by 3.1 percentage points compared to an increase of 0.8 percentage points in the overall unemployment rate.
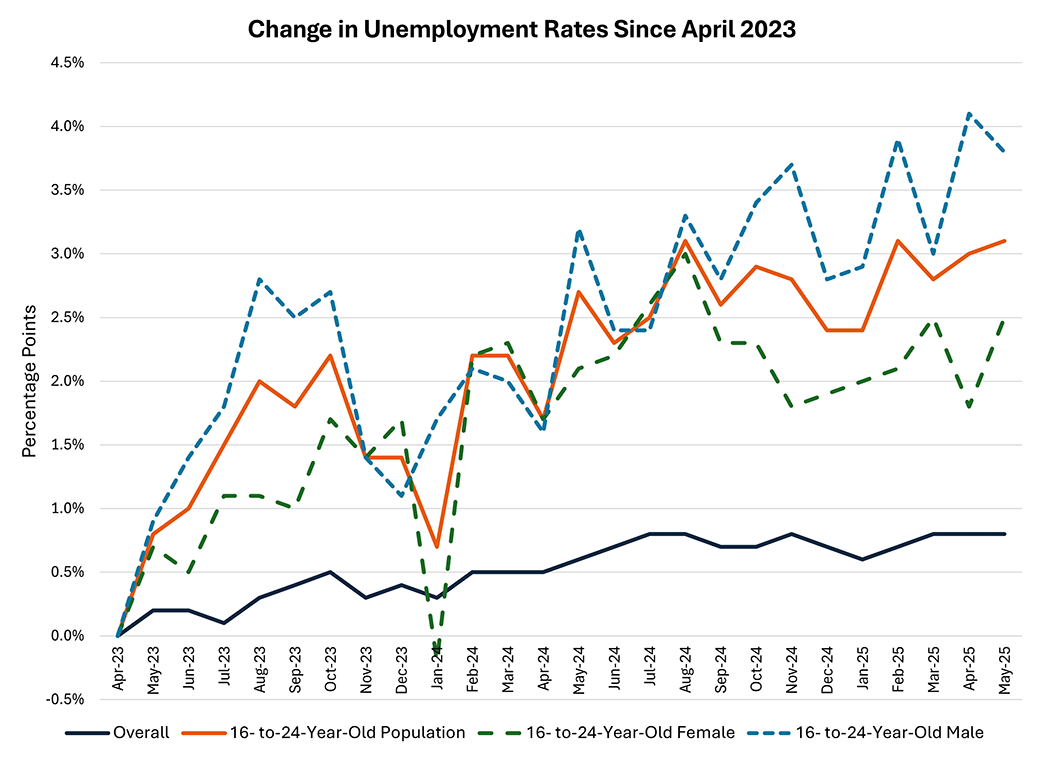
Within the younger population, male job seekers are having a harder time than female job seekers in finding employment. The male youth unemployment rate was 10.9 percent in May 2025 compared to a female youth unemployment of 8.6 percent, a gap of 2.3 percentage points compared with a median monthly gap of 1.8 percentage points since 2015. Figure 3 below shows that since April 2023, the male youth unemployment rate has risen by 3.8 percentage points compared to an increase of 2.5 percentage points in the female youth unemployment rate. The uneven gender skew of the industries that are currently hiring could be a contributing factor to the uneven gender distribution of the youth unemployment rate.
Is this a sign of trouble ahead? Not necessarily. As shown in Figure 4 below, with the exception of during the pandemic, the unemployment rate for young men has tended to be higher than that of young women over the past several decades; today's gap between male and female youth unemployment rates is in line with the range observed in recent history.
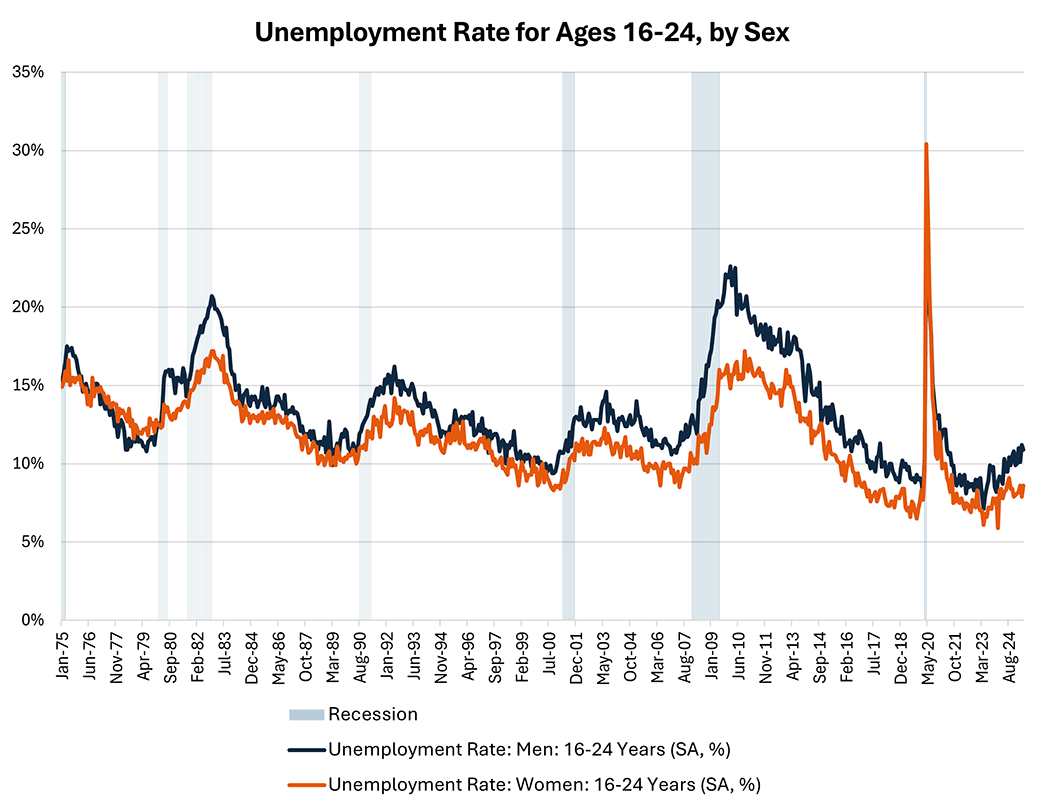
However, Figure 4 also suggests that the male youth unemployment has risen more sharply in past recessions than that of young women. This may be due to male-dominated industries such as durable goods manufacturing, construction, and mining being more sensitive to business cycle fluctuations and potentially more prone to layoffs. If that pattern repeats in the next downturn, the gap between male and female youth unemployment rates will be worth watching as an indicator of labor market weakness.
Note: Macro Minute will go on break next week following the July 4 holiday. The next post will be on July 15.
Views expressed in this article are those of the author and not necessarily those of the Federal Reserve Bank of Richmond or the Federal Reserve System.
Contact Us