The Power of Positive Thinking? Business Optimism and Investment
Macro Minute
February 11, 2025
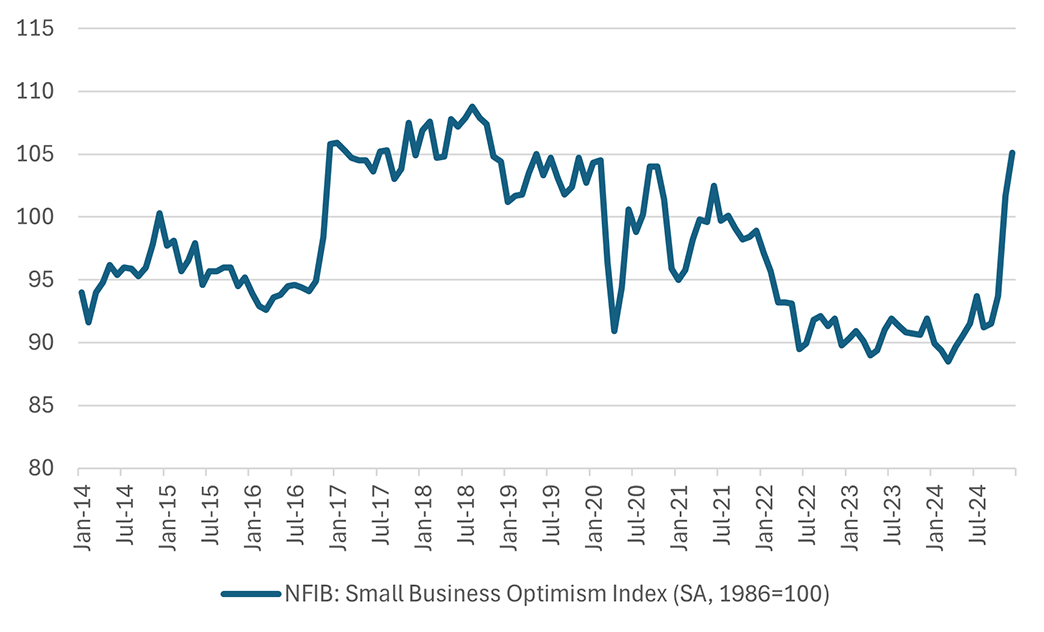
Recently, business optimism has been on the rise. For example, in the latest CFO Survey fielded by Duke University and the Richmond and Atlanta Feds, CFO optimism about the overall U.S. economy increased to its highest level in three and a half years. And the National Federation of Independent Business (NFIB) Small Business Optimism Index rose in December to 105.1, its highest level since October 2018 (Figure 1), after registering its largest-ever single-month increase in November. Could this rise in optimism lead to increased business investment? This week's post looks at the historical correlations between business optimism and measures of business investment to see whether such an outcome is likely.
To visualize the strength of the relationship between business optimism and various measures of business investment, I estimate impulse response functions, which graphically depict the impact of an unexpected one standard deviation shock to business optimism on the quarterly growth rate of the corresponding business investment variable. To do this, I first estimate a two-variable VAR which includes the Small Business Optimism Index along with a measure of business investment in capital or labor. I consider six different metrics of business investment:
- Total private sector nonfarm payrolls
- Private nonfarm production/nonsupervisory worker payrolls
- Overall nonresidential fixed investment
- Nonresidential structures investment
- Intellectual property product investment
- Real core capital goods orders
The first two variables are published by the Bureau of Labor Statistics (BLS), the next three are published by the Bureau of Economic Analysis (BEA), and the last variable is based on Census Bureau data deflated by the producer price index for private capital equipment (which comes from the BLS). All variables are aggregated to quarterly frequency, with data spanning 1986 to 2024, except for real core capital goods orders, which begins in the second quarter of 1992.1
Figure 2 below shows the estimated impulse response function associated with real core capital goods orders. Based on the historical relationship between the Small Business Optimism Index and quarterly growth rates of core capital goods orders, a one standard-deviation shock to the Small Business Optimism Index is associated with a roughly 2.5-percentage-point increase in the quarter-over-quarter annualized growth rate of residential investment. The boost is temporary and fades out after two quarters, at which point the impact on quarterly growth is statistically indistinguishable from zero (at the 68 percent confidence level).
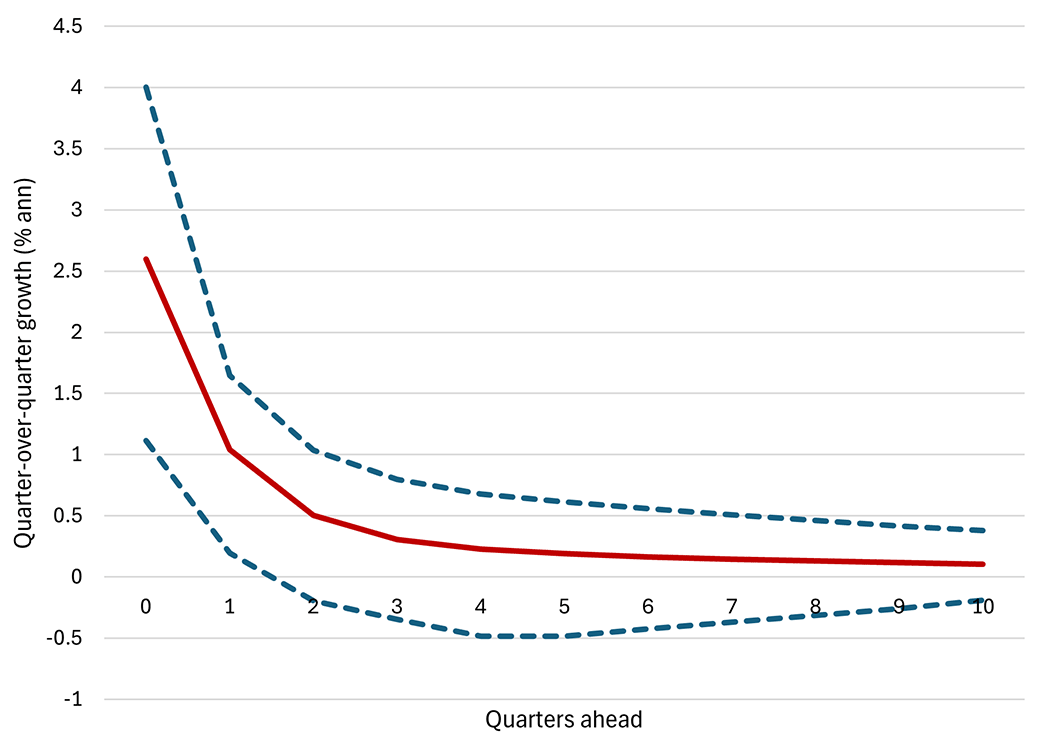
Figure 3 below shows the estimated impulse response function associated with private sector nonfarm payroll growth. A one standard-deviation shock to the Small Business Optimism Index is associated with a roughly 1.3-percentage-point increase in the quarter-over-quarter annualized growth rate of private nonfarm payrolls. In addition to being smaller in magnitude than the response estimated in Figure 2, the effect is even more temporary: It is only statistically significant in the quarter of the shock and is statistically indistinguishable from zero in the next quarter.
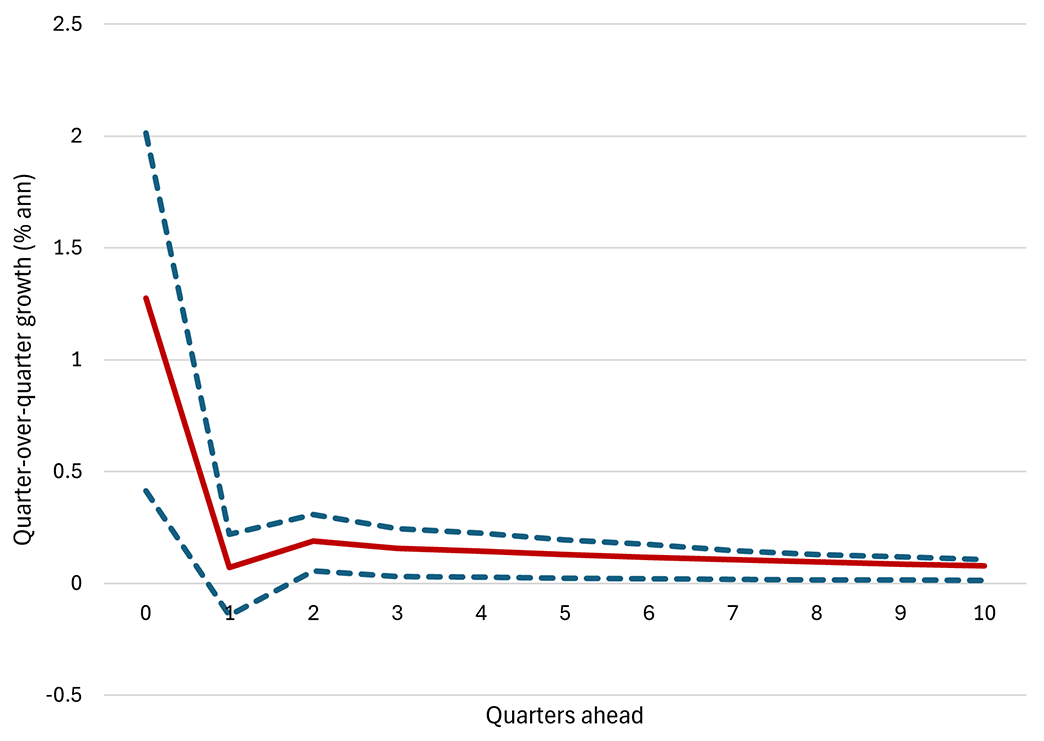
Table 1 below sorts all six business investment outcomes according to the magnitudes of their responses in the shock period. The table suggests rising optimism might affect some forms of business investment more than others. Core capital goods orders and structures investment have historically seen a bigger growth response to rising optimism. In contrast, the immediate effect of higher optimism on private sector hiring and nonsupervisory payrolls has been more muted.
| Variable (% QoQ ann.) | Initial impact of a 1 sd shock to SBO (ppt) | Lower CI | Upper CI |
|---|---|---|---|
| Real core capital goods orders | 2.60 | 1.12 | 4.00 |
| Nonresidential fixed investment (overall) | 1.61 | 0.77 | 2.28 |
| Nonresidential structures investment | 1.38 | 0.07 | 2.56 |
| NFP private production workers | 1.37 | 0.29 | 2.06 |
| Private sector NFP | 1.28 | 0.41 | 2.01 |
| Intellectual property products investment | 0.56 | 0.11 | 1.00 |
| Source: Author's calculations using NFIB, BEA, Census, and BLS data via Haver Analytics. | |||
Are these findings a testament to the power of positive thinking? Not necessarily. The identified shocks to business optimism in this exercise don't represent pure sentiment shocks. They may capture the influence of other economic variables not included in the regression, including changes to labor, tax and regulatory policies. If these policy effects do not materialize as they have in the past, we could see less responsiveness of business investment to buoyant sentiment than historical experience suggests.
Note: Macro Minute will be on hiatus next week. Happy Presidents Day!
1
To isolate the impact of a "business optimism shock" on business investment growth, I account for the correlation between the optimism and investment series via a Cholesky approach. Under this approach, the VAR is ordered with business optimism first so that it is possible to identify a shock that affects business optimism independently of the dynamics of the VAR (i.e., an "optimism shock"). In the results that follow, the shapes of the impulse response functions are sensitive to this specific ordering of variables, but the directional relationship between the two variables is robust to swapping the order of the variables in the VAR.
Views expressed in this article are those of the author and not necessarily those of the Federal Reserve Bank of Richmond or the Federal Reserve System.
Contact Us