Seeing Double: An AI Bubble?
Macro Minute
October 7, 2025
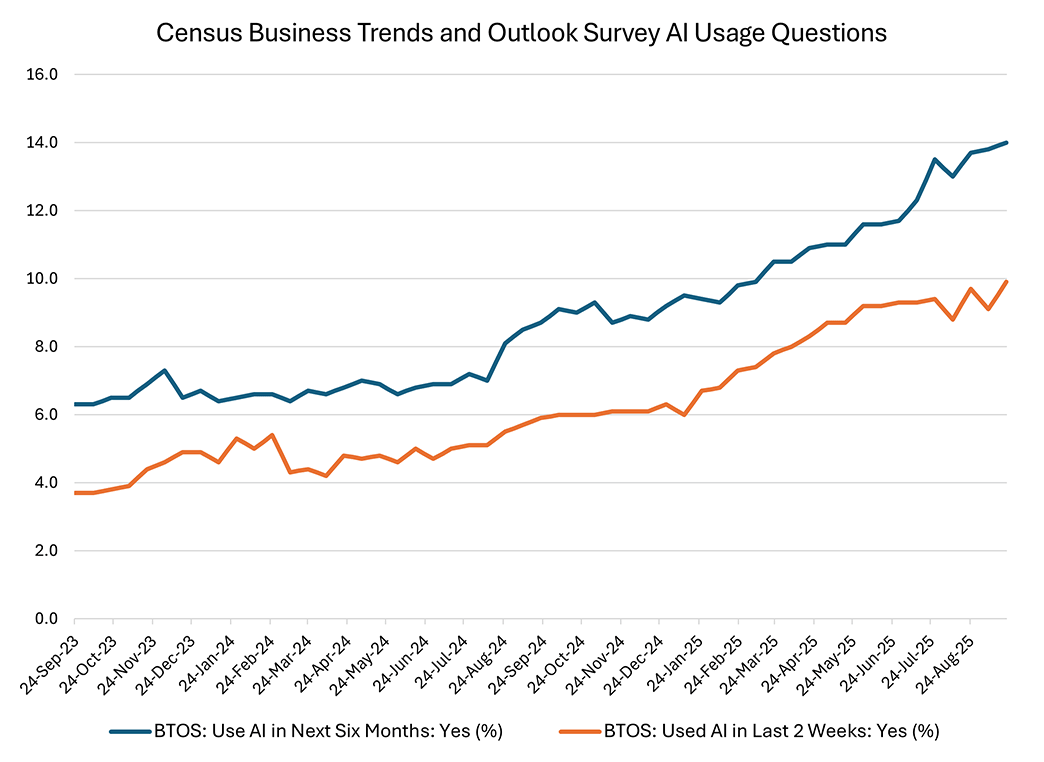
Artificial intelligence (AI)-related investment has seen significant growth over the past couple of years. According to the Census Bureau's Business Trends and Outlook Survey, the share of businesses reporting that they used AI over the past two weeks more than doubled from 3.7 percent in September 2023 to nearly 10 percent by September 2025. The share of businesses expecting to use AI over the next six months rose even faster, rising from 6.3 percent to 14.0 percent over the same period.
This is not the first time that the U.S. economy has experienced significant growth in the tech sector. While many have commented on parallels with the 1990s dot-com bubble, there was another boom and bust around the same time in the telecommunications sector, which made up an even larger share of the economy than the dot-com sector. In a 2003 Richmond Fed Economic Quarterly, my colleague Alexander Wolman documented a remarkable rise (and subsequent fall) in equity prices, real private fixed investment, and employment related to the telecommunications sector starting in the late 1990s.
To what extent does the growth in AI-related investment in the 2020s resemble the late 1990s telecom explosion? In this week's post, we compare the growth trajectory of AI investment to the telecom boom to see if there are any similarities.
Wolman's article documented a rise in real private fixed investment in communications equipment following the passage of the Telecommunications Act of 1996, which increased competition for local telephone services. At the same time, the telecom sector saw rapid technological advances in areas including fiber optics, digital wireless networks, and dial-up internet services.
The blue line in Figure 2 below plots the rise in real private fixed investment in communications equipment beginning in 1995. The orange line shows the growth in real investment in the AI-related categories of information processing equipment and software beginning in late 2022, when a popular generative AI chatbot (ChatGPT) was announced to the public.
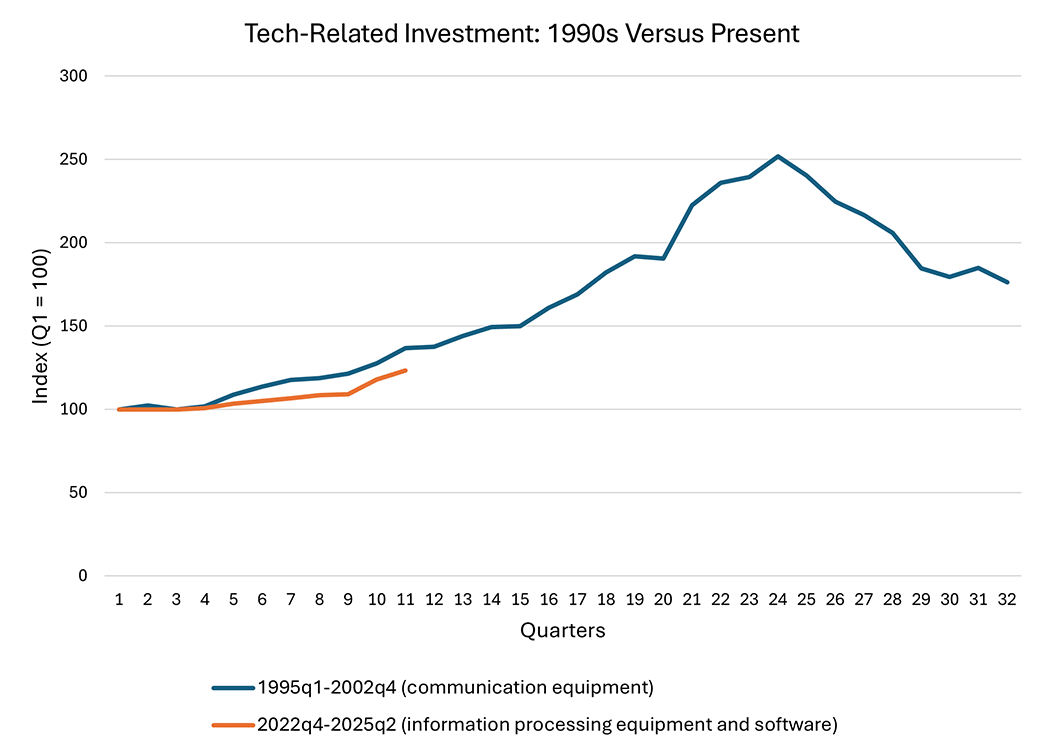
As shown in the graph, the growth in AI-related equipment and software investment since ChatGPT was released has been similar to the growth in communications equipment during the early years of the telecom boom. However, Table 1 below shows that, while investment growth trajectories have been similar across the two periods, the level of equipment investment (in inflation-adjusted dollars) is notably higher for AI compared to telecom.
| Communications Equipment | Information Processing Equipment | |||
|---|---|---|---|---|
| Quarter | 1990s | Today | ||
| 1 | Q1-95 | 11,834 | Q4-22 | 1,199,166 |
| 2 | Q2-95 | 12,106 | Q1-23 | 1,197,933 |
| 3 | Q3-95 | 11,833 | Q2-23 | 1,198,919 |
| 4 | Q4-95 | 12,037 | Q3-23 | 1,206,879 |
| 5 | Q1-96 | 12,873 | Q4-23 | 1,239,751 |
| 6 | Q2-96 | 13,443 | Q1-24 | 1,257,955 |
| 7 | Q3-96 | 13,933 | Q2-24 | 1,278,270 |
| 8 | Q4-96 | 14,056 | Q3-24 | 1,301,694 |
| 9 | Q1-97 | 14,354 | Q4-24 | 1,307,809 |
| 10 | Q2-97 | 15,084 | Q1-25 | 1,412,659 |
| 11 | Q3-97 | 16,176 | Q2-25 | 1,477,602 |
| Source: Bureau of Economic Analysis via Haver Analytics | ||||
The 1990s telecom boom also saw a surge of construction, albeit lagged relative to the rise in equipment investment. Investment in telecommunications structures was flat throughout most of the 1990s but saw a surge in 1999, as shown in Figure 3 below. In contrast, during the current AI investment surge, data center construction has taken off much more rapidly and steeply.
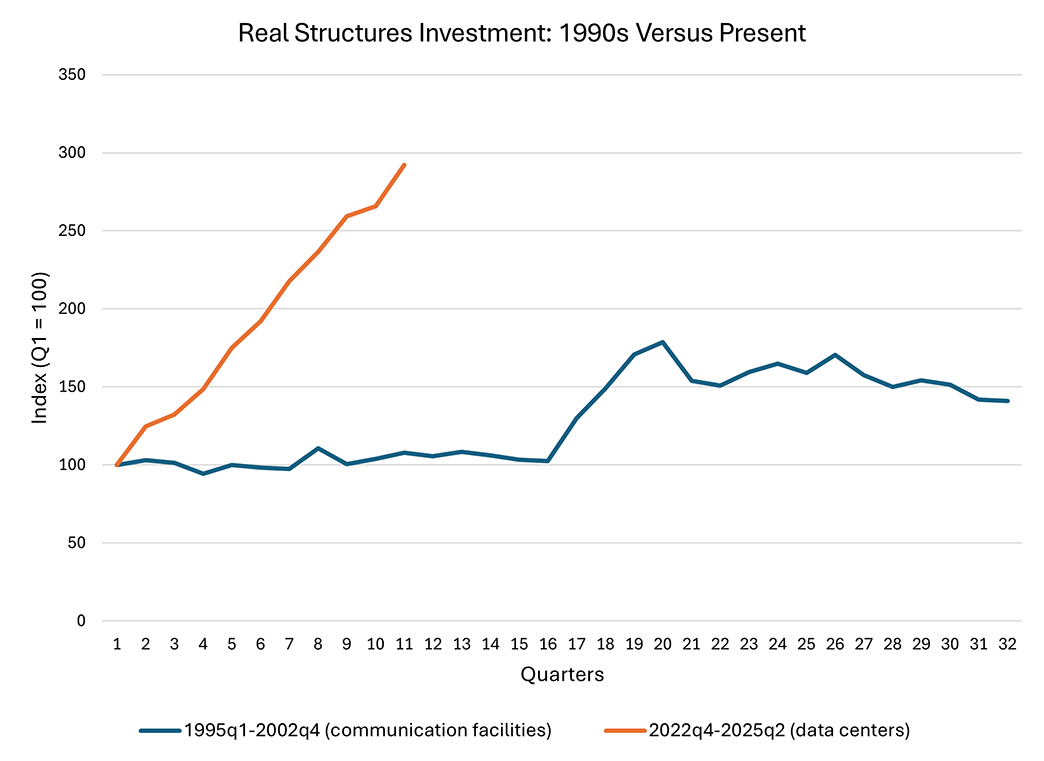
Although the rapid growth of data centers started from a much lower level when measured in inflation-adjusted dollars, the robust pace of investment has continued even as the real value of data center construction has surpassed that of communications facilities, as shown in Table 2 below.
| Communications Facilities | Data Center Investment | |||
|---|---|---|---|---|
| Quarter | 1990s | Today | ||
| 1 | Q1-95 | 19,864 | Q4-22 | 8,703 |
| 2 | Q2-95 | 20,444 | Q1-23 | 10,846 |
| 3 | Q3-95 | 20,137 | Q2-23 | 11,520 |
| 4 | Q4-95 | 18,718 | Q3-23 | 12,933 |
| 5 | Q1-96 | 19,870 | Q4-23 | 15,229 |
| 6 | Q2-96 | 19,511 | Q1-24 | 16,709 |
| 7 | Q3-96 | 19,376 | Q2-24 | 18,940 |
| 8 | Q4-96 | 21,988 | Q3-24 | 20,587 |
| 9 | Q1-97 | 19,986 | Q4-24 | 22,560 |
| 10 | Q2-97 | 20,649 | Q1-25 | 23,136 |
| 11 | Q3-97 | 21,415 | Q2-25 | 25,426 |
| Source: Bureau of Economic Analysis, Census Bureau, Bureau of Labor Statistics via Haver Analytics | ||||
In hindsight, the 1990s telecom investment surge led to tremendous, short-run overcapacity and a bust in that industry. However, demand eventually caught up to the supply buildup, so investment in telecom infrastructure did not go to waste. Given current forecasts for rapid demand growth for AI technology, it's difficult to know whether today's AI-related investment will turn out to be a repeat of the 1990s telecom boom and bust.
Views expressed in this article are those of the author and not necessarily those of the Federal Reserve Bank of Richmond or the Federal Reserve System.
Contact Us