What’s the "G" in GDP?
Macro Minute
May 13, 2025
On April 30, the Bureau of Economic Analysis released the advance estimate of GDP growth for the first quarter of 2025. Real GDP declined from its level in the fourth quarter of 2024 after several quarters of growth, which translates into an annualized growth rate of -0.3 percent in the first quarter.
Figure 1 breaks down quarterly growth into contributions from personal consumption expenditure (1.2 percentage points in the first quarter), gross private domestic investment (3.6 ppt), government consumption expenditures and gross investment (-0.3 ppt), and net exports of goods and services (-4.8 ppt).
Readers of this blog may recognize the famous "Y = C+I+G+NX" breakdown of GDP in Figure 1, expressing GDP (Y) as the sum of consumption (C), investment (I), government spending (G) and net exports (NX). However, what some readers may not realize is that the government spending captured in the GDP equation isn't usually the figure referenced by policymakers and the media when they talk about the trajectory of public spending. In this week's post, we talk about what goes into the "G" in GDP.
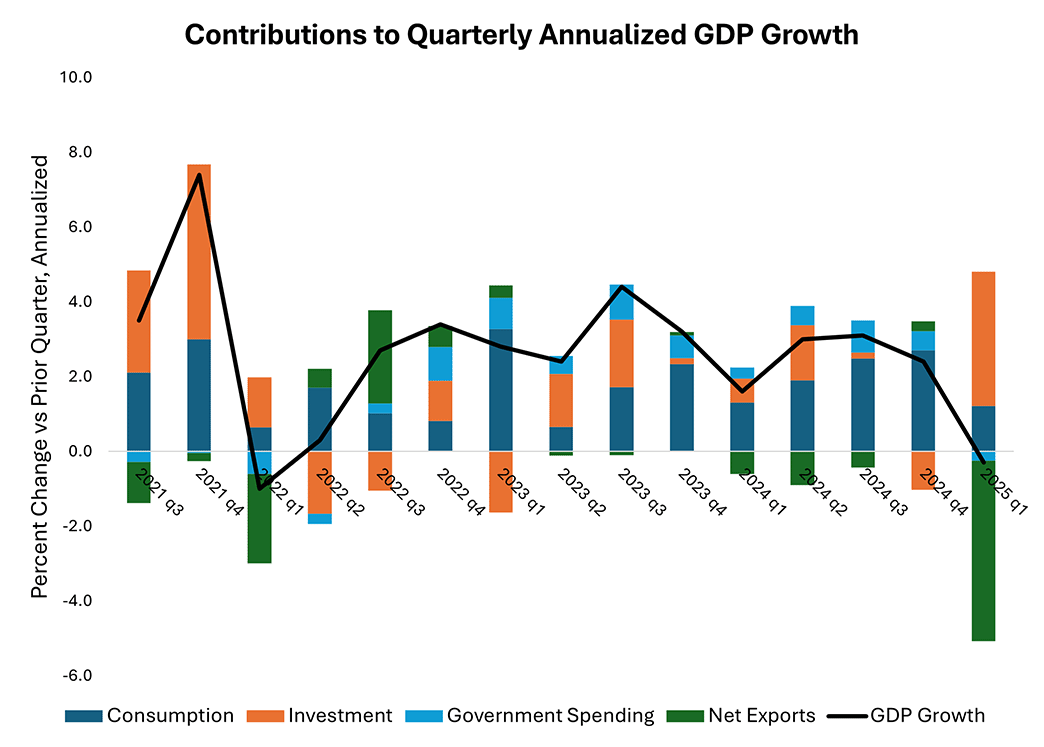
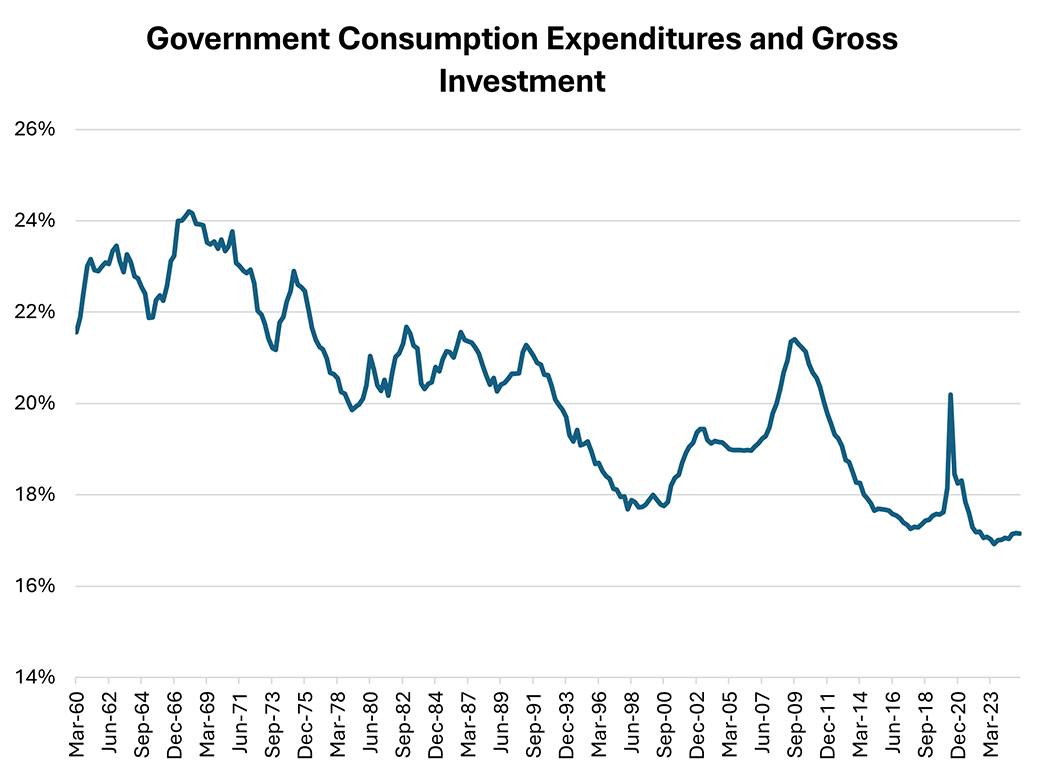
Figure 2 shows government consumption expenditures and gross investment — or the "G" from "Y = C+I+G+NX" — expressed as a share of GDP. Notably, this share has declined since the 1960s. According to the advance GDP estimate, government consumption and investment made up 17.1 percent of GDP in the first quarter of 2025, down from a recent peak of 20.2 percent in the second quarter of 2020.
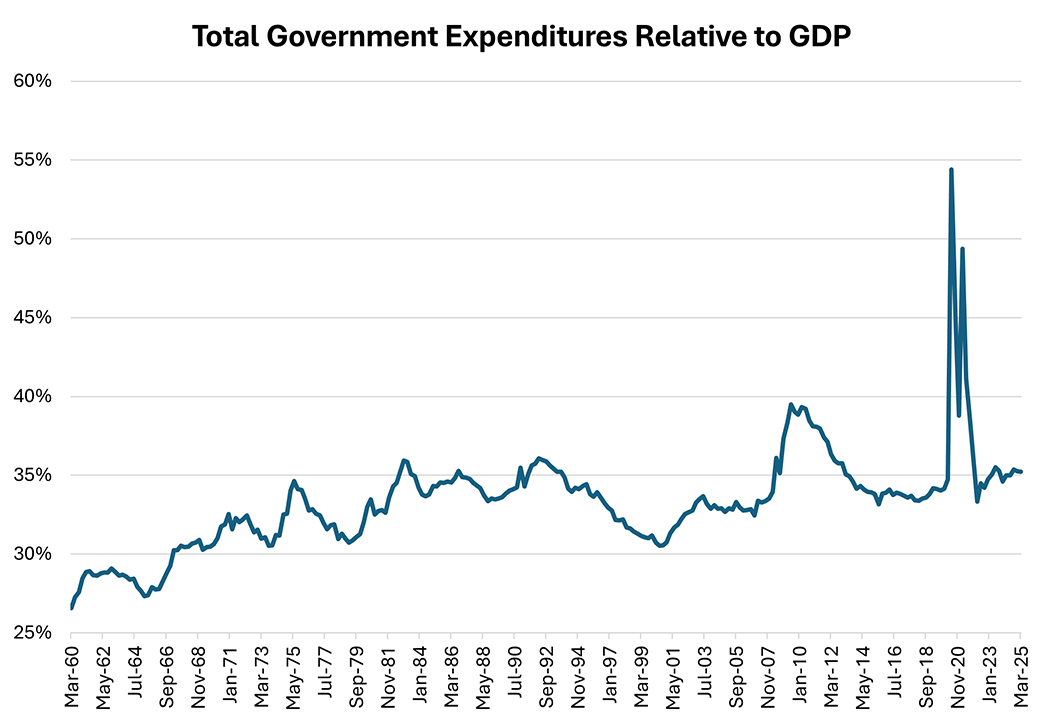
However, the BEA also publishes another concept of government spending in the National Income and Product Accounts, referred to as total expenditures. Figure 3 plots the ratio of total government expenditures to GDP, expressed as a percentage. In comparison to "G" and its 17.1 percent share of GDP in the first quarter, total government expenditures were more than a third (35.2 percent) of the size of GDP in the same period. In contrast to Figure 2, which showed a declining trend, total government expenditures have been steadily increasing relative to GDP since 2000, with temporary spikes during recessions.
The difference between these two measures stems from the fact that GDP is the total value of all final goods and services produced and sold in the country. As a component of GDP, "G" only captures the government sector's final purchases of goods and services, which is either consumed or invested. In the first quarter of 2025, these final purchases made up 48.7 percent of total government expenditures. However, as Table 1 shows, beyond the government's final purchases, total government expenditures also include transfer payments, subsidies and payments on debt.
| First Quarter 2025 | |
|---|---|
| Government Consumption Expenditures (*) | 4031.9 |
| Government Current Transfer Payments | 4720.8 |
| Government Interest Payments | 1363.4 |
| Government Subsidies | 105.5 |
| Government Gross Investment (*) | 1108.6 |
| Government Capital Transfer Payments | 51.3 |
| Net Government Purchases of Nonproduced Assets | 15.1 |
| Less: Government Consumption of Fixed Capital | 835.3 |
| TOTAL | 10561.2 |
| Note: (*) denotes a component of "G." Figures are in billions and expressed as seasonally adjusted annual rates. Rows may not sum up to total due to rounding. Source: Bureau of Economic Analysis via Haver Analytics. |
|
In particular, in the first quarter of 2025, about 45 percent of total government expenditures was in the form of transfer payments to individuals (included in "government current transfer payments" in Table 1). These are not final purchases by the government but instead end up being spent by households or businesses and recorded in GDP as household consumption or private investment.
The size of government spending and its trend over time look quite different depending on which measure we look at. For understanding the extent to which government spending affects the structure of the economy, one might argue that the GDP component is more useful. On the other hand, total government expenditure is the number to look at for questions of fiscal capacity.
Views expressed in this article are those of the author and not necessarily those of the Federal Reserve Bank of Richmond or the Federal Reserve System.
Contact Us