The Effect of Lockdown Measures on Unemployment
Special Report
September 4, 2020
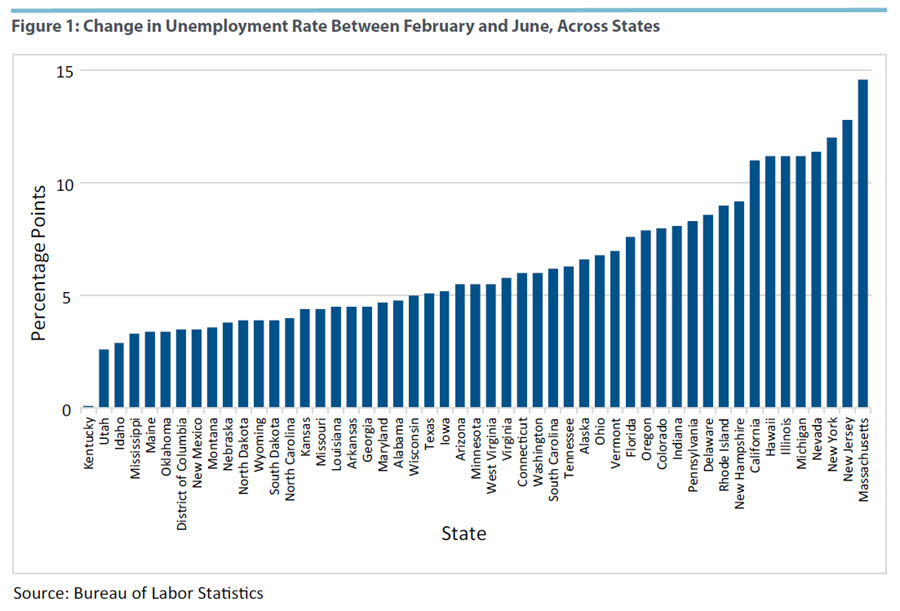
Unemployment increased sharply in all regions of the United States as a result of the public health response to the COVID-19 pandemic. But in some states the unemployment rate increased by fewer than 5 percentage points between February and June, while in others the rate increased more than 10 percentage points. (See Figure 1 below.) Can we explain state-level differences in unemployment rates based on differences in the extent and duration of lockdowns and activity restrictions across states?
Connecting Unemployment and Lockdowns
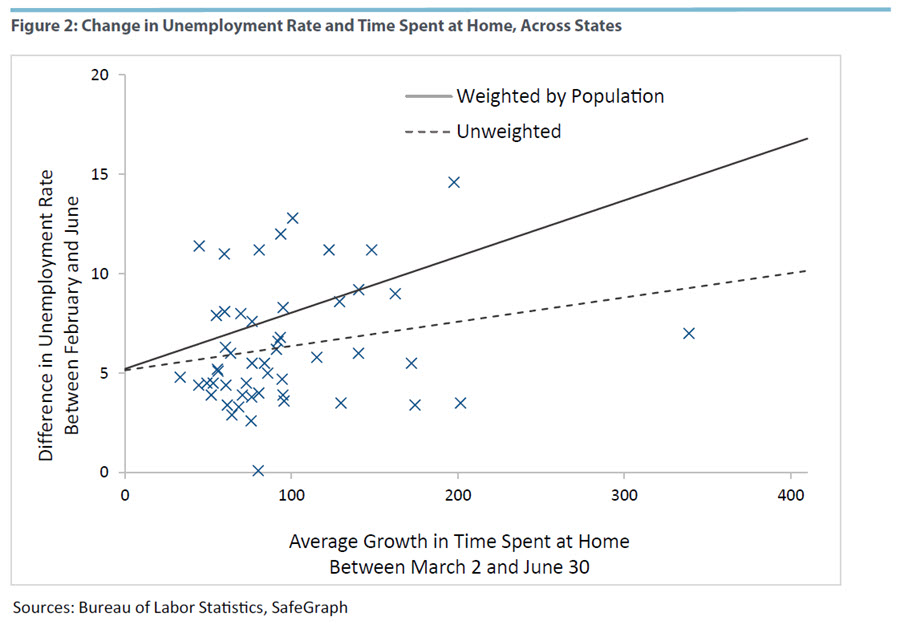
To study the relationship between unemployment and lockdowns, we rely on the measure "time spent at home" to reflect the extent of restrictions on daily activity. Figure 2 shows a clear positive association between the increase in the unemployment rate and the growth in time spent at home between March 2 and June 30. To measure time spent at home we rely on data from SafeGraph, which provides changes in time spent at home at the census block group level. We compute state averages by weighting each census block group by its population. Each cross in the figure corresponds to a state. The dashed line represents an unweighted trend, while the solid line represents the population-weighted trend. The relationship is positive and stronger when weighting by population, which suggests a stronger link between time spent at home and unemployment in heavily populated states.
Of course, an official lockdown is not the only reason why time spent at home may increase. For example, more time spent at home could reflect voluntary choices due to a preference to avoid risk. Indeed, households in many states restricted their daily activities prior to official lockdowns and remained indoors well after lockdown orders were lifted. Disentangling the effects of mandatory stay-at-home orders from voluntary restriction of daily activities requires careful consideration that goes beyond the scope of our analysis in this article. In fact, we interpret time spent at home as reflecting a broader measure of lockdown which encompasses both official and voluntary restrictions.
Another complicating factor is reverse causality. More time spent at home in a state may itself be the result of higher unemployment in the state. The most natural explanation for variation across states is differences in industry composition.
It has been widely documented that leisure and hospitality, and service sectors involving in-person interactions, have been impacted substantially more than other industries during the pandemic. As a result, it is possible that rising unemployment rates in some states could be due to greater exposure to these sensitive sectors, which subsequently creates a larger mass of people staying at home. In other words, variation in time spent at home across states could be a result of variation in industry exposure to the common aggregate shock, rather than the result of lockdown measures. In the following section, we analyze if industry composition is behind the positive relationship we observe in Figure 2.
Industry Composition as a Driver of the Spatial Variation of Time Spent at Home
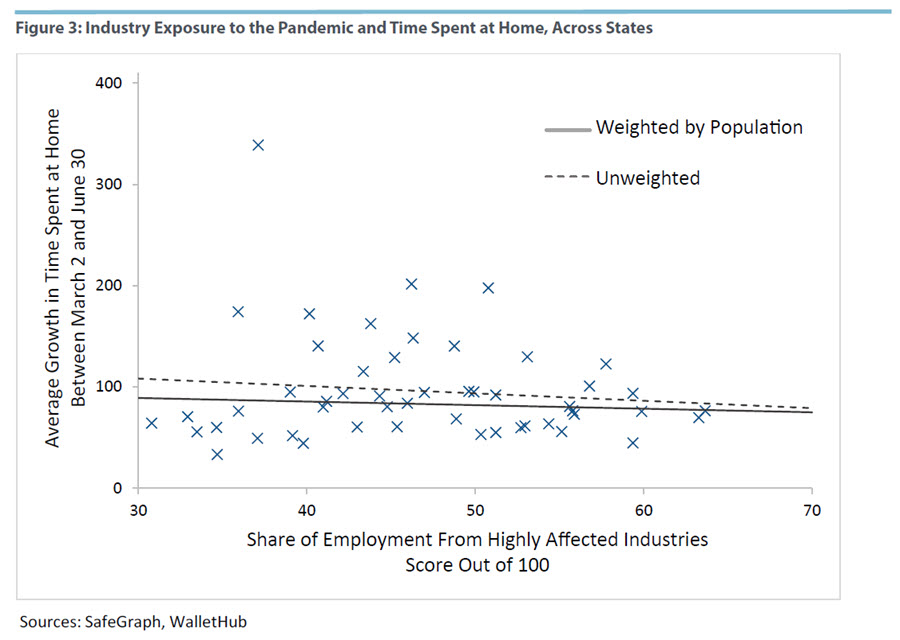
To measure a state’s exposure to sensitive industries, we use a metric constructed by WalletHub: the share of employment from highly affected industries. This measure is a weighted average of the shares of employment in highly affected industries by state, with exact weights determined by WalletHub. Figure 3 presents a scatterplot of the share of employment from highly affected industries (x-axis) and the average growth in the time spent at home variable (y-axis). Surprisingly, there is no connection between the exposure of a state to the pandemic and the time spent at home.
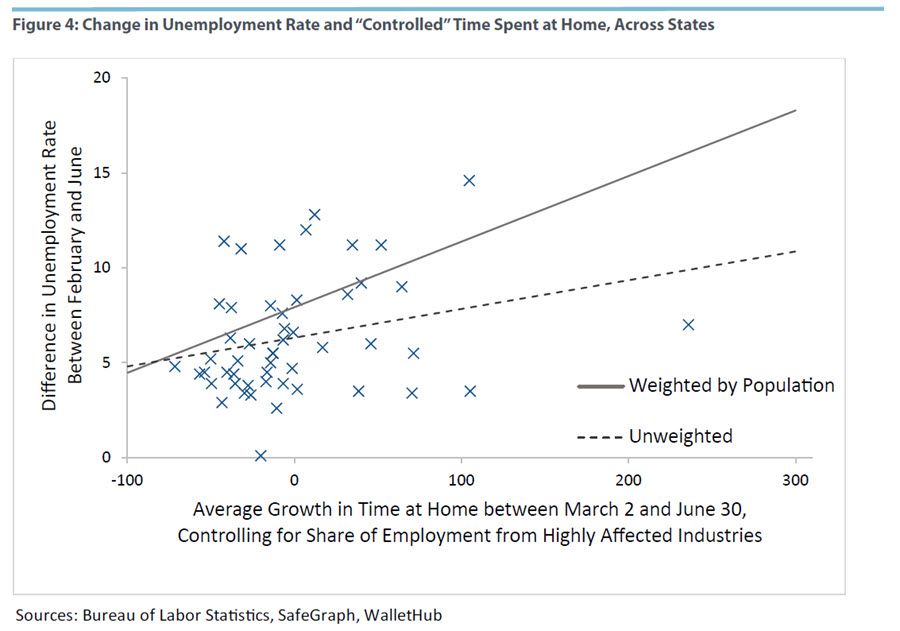
In Figure 4, we again analyze the relationship between time spent at home and unemployment with one difference: We control for industry composition. We perform this in two steps. First, we regress time spent at home on the industry exposure variable (which gives a small and insignificant coefficient as we see in Figure 3). Then, we use the residuals of the regression — which represent the growth in time spent at home controlling for industry composition — as the main variable on the x-axis. As before, we find a strong correlation between the (residual) time spent at home and the change in unemployment. Thus, time spent at home — which is partially affected by official lockdowns — affects the unemployment rate even after controlling for industry composition.
Concluding Remarks
In this article, we studied the effect of lockdown measures on unemployment. Using time spent at home — which is a broad measure of mobility — and spatial variation, we find a positive relationship between the amount of time spent at home and the unemployment rate. Our simple analysis also shows that industry composition is not driving the relationship between time spent at home and unemployment. This reinforces the idea that lockdown measures have direct effects on unemployment.
There are several other forces that could affect the interpretation of the correlation between time spent at home and unemployment that we do not consider here. For example, as we studied in a previous report, population density could explain spatial variation in time spent at home. Another option is that there is spatial variation in attitudes toward risk. For example, if the population in states with a higher increase in time spent at home is also more risk-averse, then the increase in unemployment may not be fully attributed to the extent of the lockdown.
Marios Karabarbounis is an economist, Reiko Laski and James Lee are research associates, and Nicholas Trachter is a senior economist in the Research Department at the Federal Reserve Bank of Richmond.
This article may be photocopied or reprinted in its entirety. Please credit the authors, source, and the Federal Reserve Bank of Richmond and include the italicized statement below.
Views expressed in this article are those of the authors and not necessarily those of the Federal Reserve Bank of Richmond or the Federal Reserve System.