Skip to Main Content

Understanding Recent Trends in Labor Market Participation

Econ Focus
Fourth Quarter 2018
District Digest

By many metrics, the labor market is very tight. The national unemployment rate ended 2018 at a level not seen since the 1960s, while the unemployment rate for the Fifth District reached its lowest level since the first half of 2000. The number of job openings in the United Sates exceeds the number of workers looking for jobs, and the level of initial claims for unemployment insurance is near a 50-year low. Businesses indicate that finding and retraining workers is difficult. Yet the percentage of working-age adults in the country who are active in the labor market — the labor force participation rate — is below where it was prior to the Great Recession. A similarly broad metric of the labor market that compares the number of employed persons in the country to the working-age population, the employment-to-population ratio, also remains well below prerecession levels. Do these metrics imply that the labor metric is not as tight as thought — that there is additional slack? Are there workers who left the labor market and are available to return should the right opportunity arise?

Some point to the fact that wages have increased only moderately and wage growth remains below rates during other expansion periods as an indication that there is some additional slack in the labor market. The lack of wage growth has been unexpected — particularly given the drop in the unemployment rate from 10 percent to under 4 percent. When something becomes scarce or less abundant, all other things being equal, the price would be expected to rise. Perhaps what is muting the price increase is the availability of labor that is currently out of the labor force.

Another unexpected fact of the labor market in recent years has been the strength of the monthly job gains. Given population and labor force growth, the number of monthly job gains necessary to incorporate new entrants into the labor market is estimated to be between 50,000 and 110,000 jobs. Actual job growth in 2018 far surpassed this level at close to 225,000. In a tight labor market, with a low unemployment rate and labor scarcity, one would have expected to see greater moderation in the monthly job gains — but that has not happened. Perhaps the explanation, once again, is hidden slack: workers not in the labor market who are entering as opportunities arise.

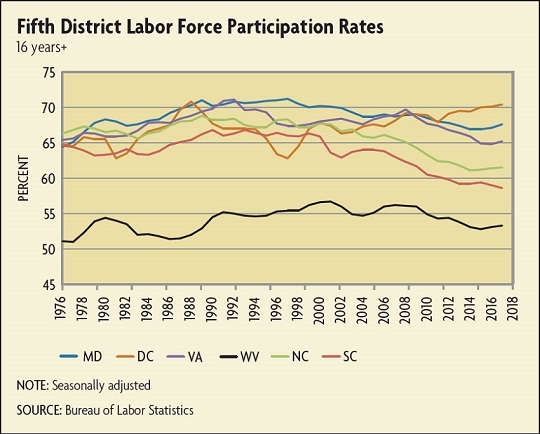
In response to these questions, there has been a lot of research devoted to understanding movements in the labor force participation rate. It has been in decline since the late 1990s and that decline accelerated during the Great Recession and afterward. Is the accelerated decline due to transitory factors associated with the business cycle, changing trends in the demand for labor, changes in the demographic composition of the labor force, or some combination thereof? This article will review some of the research that examines the decline in these metrics and then look to see if this research helps explain the trends in the Fifth District.

A Look at the Trends

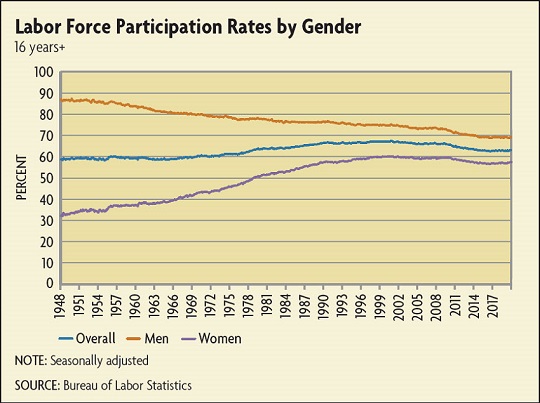
In the latter half of the 20th century, the percentage of workers engaged in the labor force rose considerably. The labor force participation rate increased by roughly 8 percentage points from the 1960s to 2000 — from just under 59 percent to just over 67 percent. The employment-to-population ratio experienced a similar increase over the same period. Underlying the increase in employment and the labor force were several factors: (1) a large demographic group entering the labor force — the baby boomers, (2) an increase in educational attainment, and (3) women entering the workforce in greater numbers. After peaking at 67.3 percent in early 2000, the labor force participation rate declined in two stages: gradually during the first half of the 2000s before leveling off just prior to the Great Recession and then more sharply during and after the Great Recession until reaching a 40-year low of 62.5 in 2015. It is notable that in 2017, the U.S. labor force participation rate for prime-age workers (aged 25 to 54) ranked 40th out of 50 among countries in the Organization for Economic Co-operation and Development — a fact that would perhaps surprise some as American culture is sometimes associated with a stronger emphasis on work and less on leisure than other cultures.

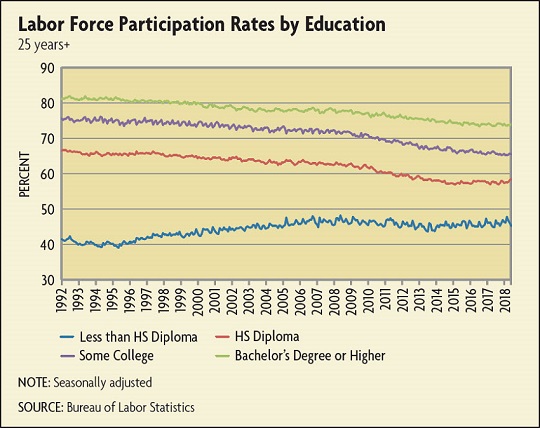
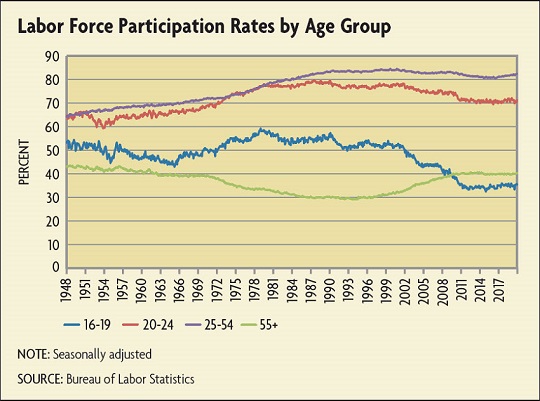
Underlying the overall decline are movements by various subgroups within the labor market. There are notable difference in trends by age group, gender, and educational achievement. The labor force participation rate for men has been in decline for many decades, while the rate for women rose consistently from 1960 to 1980 before slowing during the 1990s. (See chart below.) The participation rate for women peaked at 60.3 in early 2000 before declining to 56.4 in 2015 and has edged slowly higher in recent years.

The more educated a worker, the more likely he or she will be participating in the labor market. The labor force participation rate for workers with less than a high school diploma was 46.1 percent at the end of 2018, while the participation rate for workers with a bachelor’s degree or higher was 73.6 percent. (See chart below.) Note that for workers with a high school diploma or higher, the participation rate has been steadily declining in recent decades. In contrast, the participation rate for workers who have not finished high school rose from 39 percent in 1995 to just over 48 percent in 2008. It then declined until 2014 and has moved higher in recent years but has not regained its previous high.


With respect to age, while there was a fairly steady decline for prime-age workers from 2000 to 2015 (with the exception of 2005 to 2008), there was a much larger decline for younger workers — particularly workers aged 16-19. (See chart below.) In contrast, the participation of older workers (55 and older) increased from 1990 to 2010 and has held steady since.


Explaining the Changes in Labor Force Participation

There has been a considerable amount of research looking at these trends. Much of the work concludes that longer-term secular trends are responsible for the decline as opposed to temporary cyclical factors. One of the key drivers in the decline in the U.S. labor force participation rate is demographics. As mentioned above, a key trend in recent decades has been in the increase in the share of older workers (55 and older). Not surprisingly, this is due to the population getting older — specifically, the aging of the baby boomer generation. Given that the labor force participation rate of older workers is considerably lower, the increase lowers the overall participation rate. Researchers who have looked at this have found that this accounts for a sizeable portion of the overall decline.

Andreas Hornstein of the Richmond Fed, Marianna Kudlyak of the San Francisco Fed, and Annemarie Schweinert, formerly of the San Francisco Fed, constructed a hypothetical labor force participation rate by fixing the educational composition of the population and the participation rate of each group at their 2000 levels and using the actual age-gender population shares as weights. In a 2018 San Francisco Fed Economic Letter, they found that changes in age-gender composition of the population caused about three-fourths of the decline in the overall rate. Similarly, in a 2017 article in the Brookings Papers on Economic Activity, Alan Krueger of Princeton analyzed the participation rate using a similar methodology and found that the shift in population shares accounted for 65 percent of the decline in the participation rate between 1997 and 2017. Moreover, because the aging of the population is expected to continue, its downward effect on labor participation will most likely continue. In a 2017 article in Economic Insights, Michael Dotsey, Shigeru Fujita, and Leena Rudanko of the Philadelphia Fed projected that rising retirements will continue through the late 2020s, which would imply a roughly 4 percentage point decline in the participation rate over that period.

Other factors besides demographics are at work, however. The decline in the labor force participation rate among prime-age workers over the past two decades has been particularly pronounced for prime-age males, whose participation rate declined by 2.6 percentage points from 2000 to 2018. There have been a number of explanations put forth to explain this decline.

John Coglianese, a Ph.D. candidate at Harvard University, argued that a change in how men are attached to the labor market is a factor. In his paper "The Rise of In-and-Outs: Declining Labor Force Participation of Prime Age Men," he found that one-third of the decline in the labor force participation rate of prime-age males is due to an increase in occasional short breaks between jobs. He argued that despite these breaks, these individuals are highly attached to the labor force and work typical jobs but are notable in that they take brief breaks outs of the labor force. He found that married or cohabitating men are taking more breaks and account for about half of the increase in "in-and-outs." He attributed this rise to a wealth effect from their partners' growing incomes. Young men increasingly living with their parents accounted for much of the rest of the increase.

An article by an economist at the Kansas City Fed, Diden Tuzemen, argued that a decline in the demand for middle-skill workers due to job polarization along with increased international trade and weakened unions accounted for most of the decline in participation among prime-age men. He looked at the increase in the nonparticipation rate (out of the labor force) for prime-age males by education level and noted while there is an increase across all education levels, the increase was largest for males with a high school degree and those with an associate's degree or some college (middle-skill workers). He also pointed out that at the same time that more middle-skill workers were not participating in the labor force, the share of employment by occupations with middle skills declined considerably over the past two decades, while the share of low-skilled and high-skilled occupations increased.

Research has looked at the impact of trade on employment and found that dislocations due to increased imports may have pushed down labor participation rates. In a 2016 article in the Journal of Labor Economics, "Import Competition and the Great U.S. Employment Sag of the 2000s," Daron Acemoglu and David Autor of MIT, Brendan Price of the University of California, Davis, David Dorn of the University of Zurich, and Gordon Hanson of the University of California, San Diego argued that slow employment growth between 2000 and 2007 was due to greater import competition from China. They estimated the direct and indirect impact of Chinese imports on U.S. manufacturing and found sizeable negative effects on employment — for industries directly exposed to import competition as well as indirectly for upstream industries. In theory, the employment lost to import competition would be expected to be reallocated to other industries, but they found no evidence that this occurred. They argued that the reallocation into nonexposed industries is overwhelmed by a negative adverse demand effect. Prime-age males comprise the majority of manufacturing employment, so as a result, the negative impact of trade could be a factor explaining the decline in participation by prime-age males.

Two other factors cited by research are the rise in disability and the opioid crisis. Dotsey, Fujita, and Rudanko noted that the decrease in the overall participation rate since 2000 has been due to roughly equal increases in the number of nonparticipants citing "in school," "retired," or "disabled." Krueger analyzed the effect of the opioid crisis by looking at survey data and opioid prescription rates to see if the sharp rise in prescription rates had an impact on labor markets. His results suggest a link between the opioid crisis and depressed labor force participation. Still, the effects of the opioid crisis remain difficult to isolate; it could be that poor labor market outcomes result in opioid usage in some instances, while opioid use drives poor labor market outcomes in others. Or it could be that some other factor is related to both. (See "The Opioid Epidemic, the Fifth District, and the Labor Force," Econ Focus, Second Quarter 2018.)

Fifth District Trends

We see similar trends within Fifth District labor markets. As in the national data, the labor force participation rate declined in each of the district jurisdictions from 1997 to 2017 — with the exception of the District of Columbia, where the rate increased sharply. The largest declines were in the Carolinas, where the participation rate dropped close to 7 percentage points; declines in other states were much less severe — 3.6 percentage points in Maryland, and 2.2 percentage points in Virginia and West Virginia. (See chart below.) The participation rate itself also varies considerably, from West Virginia's 53.3 percent to the District of Columbia's 70.4 percent.

What is driving the differences among jurisdictions? Not surprisingly, many of the same demographic factors as on the national level are at work. One is education. As noted earlier, workers with higher levels of education are more likely to be in the labor force and employed. In terms of education, West Virginia stands out in that the percentage of the population aged 25 or older with less than a high school education is the highest in the district, although South Carolina is not far behind, and that the percentage with only a high school degree is the highest — and by a considerable margin (41 percent versus an average of 25 percent for the other five jurisdictions). At the same time, the percentage of workers with college or advanced degrees is the lowest. Still, other factors must be at work as well. Even when looking at participation rates by education level, West Virginia is still lower than the rest of the district, and this is true across all education levels. Most notably, only 36 percent of West Virginians with less than a high school diploma were in the labor force versus an average of 60 percent for the rest of the district. In contrast, the District of Columbia has the highest participation rate and the highest percentage of people with college and advanced degrees – as well as the lowest percentage of the population with high school diplomas or less.

Much like the national picture, changes in participation rates by age and gender as well as the aging population help to account for recent Fifth District trends. The aging of the baby boomer generation is at work within district jurisdictions with one notable exception, the District of Columbia, which has been getting younger. From 2005 to 2017, the percentage of the population 55 or older increased between 5.6 percent in Virginia to nearly 7 percent in South Carolina. Moreover, within the 55 and older age group, the larger increase has been for the population above the age of 64 — whose participation rate is considerably lower. At the same time, in contrast, the median age in the District of Columbia fell by almost two years.

With regard to gender, too, the Fifth District's economies largely parallel the nation's. In the district, the participation rate for males aged 20 to 64 declined by 2.7 percentage points from 2005 to 2017. This was partially offset by an increase in the participation rate of females by 2.2 percentage points. The male participation rate remained considerably higher than the female participation rate, though the gap has declined — the average difference across district jurisdictions was 7.3 percentage points in 2017, down from 12.2 percent in 2005.

In addition to demographics, what other factors may be influencing labor market outcomes in the Fifth District? Job polarization within the district appears to be a factor behind the decline in the participation rate of males. Richmond Fed research has found that with the exception of the District of Columbia, the middle-salary occupation group has grown more slowly than higher- and lower-salary occupations — consistent with the notion that increases in technology were displacing middle-skill employment. (See "Post-Recession Labor Market Trends in the Fifth District," Econ Focus, Third Quarter 2015.)

Another factor cited earlier is the opioid crisis. The hardest-hit jurisdiction in the Fifth District, West Virginia, has seen improvements. The usage rate there was exceedingly high in the late 2000s, peaking at 146.9 prescriptions per 100 people in 2009 — 1.8 times greater than the national average. It has since dropped sharply to 81.3 in 2017, which is still significantly greater than the U.S. average, but the gap has shrunk.

Did opioid usage contribute to a decline in the participation rate in the Fifth District? The high usage rates along with anecdotal information from businesses, nonprofits, and hospitals within the district suggest opioid usage did hurt the supply of labor. As noted earlier, however, the scale of this effect is difficult to assess.

Conclusion

The labor force participation rate peaked in the late 1990s and had been in decline until the last few years. The labor market continues to tighten, with strong job growth and an unemployment rate nearing lows not seen since the late 2000s and 1960s. Much of the explanation for the changes in participation lies in long-term secular trends, demographics in particular. An aging population has had an enormous impact, but the participation rates of young workers and older workers have had a noticeable impact as well. The long-term decline in the participation rate of men is less well understood. Job polarization, the impact of trade on manufacturing, the rise in disability, and the opioid crisis have been looked at as possible explanations. There is some suggestive evidence that job polarization and opioid usage are factors affecting the district's labor market. The changing age profile of the Fifth District, changes in participation rates by age and gender, and differences in educational attainment are large factors underlying participation rates across the district.

Subscribe to Econ Focus

Receive an email notification when Econ Focus is posted online.

Subscribe to Econ Focus

By submitting this form you agree to the Bank's Terms & Conditions and Privacy Notice.

Phone Icon Contact Us

David A. Price (804) 697-8018