Moving Macroeconomic Analysis beyond Business Cycles
Economic Brief
April 2019, No. 19-04
When analyzing macroeconomic data, it helps to separate longer-term trends from business cycle fluctuations, which may have distinct causes and respond differently to policy. This Economic Brief presents research that uses a novel methodology to establish stylized facts for four key macroeconomic variables for cycles of different durations. This brief makes the case that research and policy should focus on four aspects of economic fluctuations: a short-term component (cycles of less than two years), a business cycle component (cycles between two and eight years), a medium-term component (cycles up to thirty-two years), and a long-term component (the trend).
Economic fluctuations are complex phenomena. In the pursuit of understanding how an economy evolves over time, economists have found it useful to separate long-run trends from business cycle fluctuations, where the latter are generally considered to be those fluctuations that occur with a cycle length of two to eight years, measured as the period between business cycle peaks.1 For example, the unemployment rate is thought to have a long-term "natural" component that is determined by slow-moving "structural" features of the economy — such as labor productivity and the size of the labor force — and a business cycle component that is influenced by shorter-term conditions such as demand shocks. These components together make up how the actual unemployment rate varies. Likewise, inflation can be seen as the sum of long-term "core" inflation and a component influenced by more volatile prices (for example, food and energy prices).
However, there is a growing awareness in the macroeconomics literature that this view of economic fluctuations as being a combination of business cycles around a long-term trend is not adequate to characterize the behavior of economic activity over time. For instance, Diego Comin and Mark Gertler argue that a substantial part of economic fluctuation is located in what they label a "medium-term cycle," that is, fluctuations that persist beyond eight years but fall short of becoming a long-term trend.2 Using a theoretical model, they argue that business cycles and medium-term cycles are intimately connected since they could be driven by the same underlying temporary shock. For example, a temporary change in productivity or the policy rate can reverberate throughout several cyclical components as it gets propagated over time.
Fortunately, economists have developed increasingly flexible tools for analyzing time series data and decomposing them into their cyclical components. This Economic Brief discusses research by three of its authors — Lubik, Matthes, and Verona — who provide a more encompassing view of cyclical behavior across all frequencies.3
The researchers decompose key macroeconomic time series using a technique called wavelet-based filtering. This approach breaks down a time series into several cycles: a short-term component (less than two years), a business cycle component (between two and eight years), a medium-term component (frequencies up to thirty-two years), and a long-term component (the trend). The results show that different macro data series indeed do exhibit different patterns: GDP is dominated by a high-frequency cycle, unemployment by medium- to long-term cycles, and inflation and interest rates by low-frequency cycles. These findings have implications for the focus of monetary policy.
The Debate over Medium-Term Cycles
There is a long-standing debate over whether a frequency-based view of economic fluctuations is useful for analyzing and understanding policy.
One critical viewpoint is provided in a 1993 paper by Mark W. Watson, who argues that policy analysis based on frequencies would be difficult to communicate.4 This viewpoint is implicitly questioned in 2003 research by Alexei Onatski and Noah Williams, who study the effects of uncertainty on monetary policy decisions.5 They show that when uncertainty enters a policymaker's decision problem at different frequencies, it may have substantially different effects on outcomes. This criticism of the Watson view is taken up in a 2007 article by William Brock, Steven N. Durlauf, James M. Nason, and Giacomo Rondina, who analyze the differential effects of various policy rules on outcomes across frequencies.6 In a follow-up 2013 paper, Brock, Durlauf, and Rondina demonstrate how reductions of variance at some frequencies lead to increases in variance at other frequencies, creating a policy trade-off.7
The research by Lubik, Matthes, and Verona informs this debate by using a technique called wavelet multiresolution analysis, which allows the decomposition of aggregate time series into different components that are associated with specific frequencies but that can be represented as time series themselves.8
The results of this analysis are represented by the accompanying figures. The light blue lines are the raw data — that is, the time series themselves — and the dark blue lines reveal the contributions of each of the four time components. The series are additive, meaning the dark blue lines in the four charts for any one macroeconomic variable, when added together, produce the light blue lines. Thus, at any point in time, the graphs reveal how much each cycle length contributes to each time series' movements.9
One attribute of the wavelet decomposition approach is that the choice of time components allows the researcher to isolate specific cycle lengths that are objects of interest. Traditional decomposition techniques tend to impose strong assumptions about the data-generating process — specifically, they often require data to be stationary or prefiltered. However, many economic and financial time series are hardly stationary as they exhibit trends and patterns such as structural breaks, volatility clustering, and long memory, which the wavelet approach can handle with ease.
The researchers add to this literature by establishing a set of stylized facts for U.S. macroeconomic aggregates (real GDP growth and the unemployment rate), interest rates (the fed funds rate, various Treasury rates, and the term spread), and prices (PCE inflation) from the third quarter of 1954 through the third quarter of 2017.
Stylized Facts on the Real Economy
Several interesting stylized facts emerge from the authors' analysis.10
For real GDP growth, the authors find that fluctuations are mostly short-term noise. (See Figure 1 below.) Specifically, more than 50 percent of overall fluctuations in year-over-year real GDP growth are explained by short-term components, roughly one-third by the business cycle component, with the rest by medium- to long-term components. This analysis raises questions about whether and to what extent macroeconomic stabilization policy can affect this short-term component, especially since it is likely to contain measurement errors. The flip side of this finding is that the level of GDP is almost exclusively driven by its long-run trend.
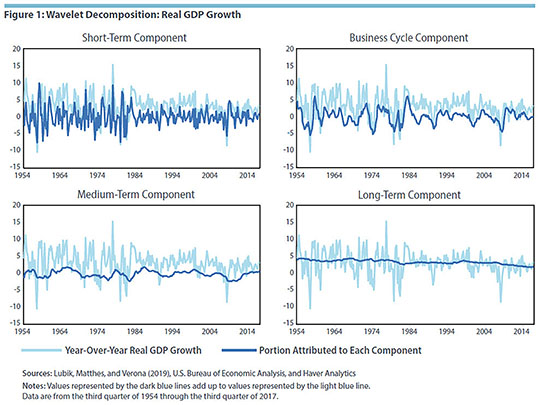
The analysis also sheds light on the widely discussed secular decline in real GDP growth. The low-frequency component of real GDP declines from greater than 4 percent to less than 2 percent over the course of the sample, in line with the secular decline in trend growth that has been found in numerous studies. The Great Moderation is most visible in the decline of the volatility of the short-term component starting from the mid-1980s and to a lesser extent in the business cycle component.
In contrast to real GDP growth, unemployment is a medium-term phenomenon — even though it is typically thought of as something conventional monetary policy (a higher-frequency instrument) affects fairly directly. (See Figure 2 below.) Specifically, roughly one-third of unemployment fluctuations are due to short-term and business cycle movements, while medium- and longer-term cycles each explain around 20 percent. What dominates the level of the unemployment rate is its long-term component, which could be interpreted loosely as a natural rate of unemployment.
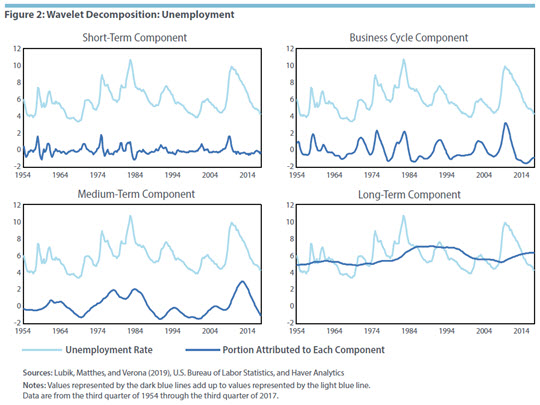
What is striking is that the different components do not seem to move closely together. For instance, the unemployment rate is at 5.4 percent in 1990, while the long-term component is at 7.2 percent, the difference being made up by medium-term components. In other words, the business cycle peak produces a negative unemployment gap relative to a very high natural rate on account of strong medium-term components that might be tied to labor force participation peaking in the late 1990s. Finally, the Great Moderation is considerably less visible in the unemployment rate, if at all.
As noted, one reason the findings about unemployment are interesting is that monetary policy is typically focused on business cycle stabilization, but unemployment is dominated by medium-term trends. A key research question, therefore, is to what extent monetary policy can affect these medium-term fluctuations, which are generally thought to be outside the purview of policymakers. Similarly, an inclusive approach would rest on the ability of policymakers to differentiate between different cycle lengths or to weight them differently in their objectives. (Also, it should be noted that the workhorse macroeconomic models used by policymakers do not do well at capturing medium-term cycles.11)
In the absence of such an encompassing view of policy, an alternative would be for policy to focus on the stabilization of inflation.
Stylized Facts on the Nominal Economy
Forty percent of inflation movements can be traced to the long-term component. (See Figure 3 below.) The business cycle component explains around one-fifth of the overall variability, while medium-term components cover 25 percent. The remaining 15 percent of inflation variability can be traced to short-term or noise components.
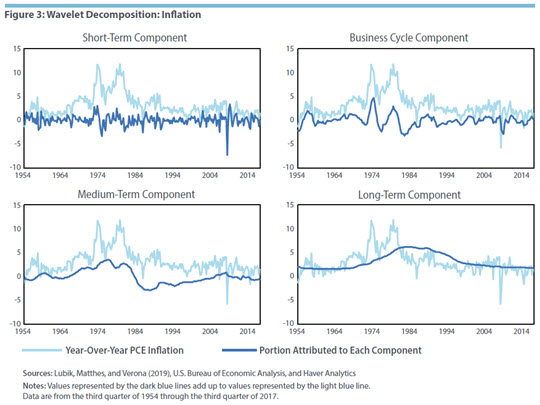
The monetary policy literature often interprets the long-term component as the inflation target or the perception of one; it also can be seen as a measure of the extent to which inflation expectations are anchored. In the authors' decomposition, year-over-year PCE inflation's long-term component shows a gradual rise from almost zero in the late 1960s to a peak of 6.2 percent in the early 1980s followed by a gradual decline to the 2 percent target in the 2000s.
A similar pattern in terms of the Volcker disinflation can be found in the medium-term components. What is striking is the run-up in trend inflation over the course of the 1970s and the drawn-out, three-decade-long struggle to return it to 2 percent.
Since the Federal Reserve arguably did not change its implicit inflation target over that time, this component may therefore be better described as the public's perceived target. If that is the case, the results depict a striking loss of central bank credibility. In light of this aspect, it is perhaps surprising that there is not much of a Great Moderation visible when interpreted as a binary event. In other words, if we think of the Great Moderation as a change in policy or some other structural change around the early 1980s, then such a change is not particularly visible in the inflation series. Instead, the graphs show high volatility in the 1970s, preceded and followed by the more stable 1960s and 1980s, respectively. Interestingly, inflation volatility seems to go up again in the 2000s, especially around the Great Recession.
Decompositions for the federal funds rate (Figure 4 below) and the ten-year Treasury rate (not shown) reveal similar patterns as the inflation decompositions, whereby volatility in the ten-year rate can be attributed largely (almost 70 percent) to the long-term component. For short-term rates, the percentage falls to about 60. Presumably, this difference shows that longer rates are less subject to the vagaries of higher-frequency fluctuations.
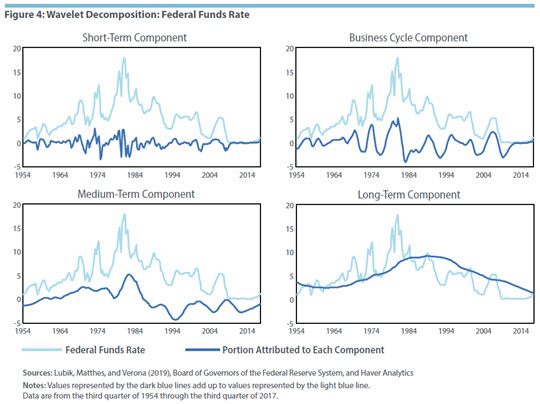
Since interest rates share common components, especially in the medium and longer run, it is therefore often instructive to consider the term spread, in this case the difference between the ten-year rate and the three-month rate. The term spread decomposition (not shown) puts the most weight (almost 45 percent) on the business cycle components. This finding supports the idea that at frequencies commonly associated with the business cycle, the spread is a useful indicator of economic and financial conditions. Interestingly, the long-term component has gone up considerably since the early 1980s to a level above 2 percent, implying that the difference between the short and long rates has become more persistent.
Summary
The research discussed in this Economic Brief advances two key findings.
First, cycles of what has traditionally been identified as business cycle length (two to eight years) play only a secondary role in explaining overall aggregate fluctuations. More than two-thirds of inflation and unemployment fluctuations in the United States occur at low frequencies, whereas at most a quarter are attributable to business cycle frequencies. However, it is mainly these latter fluctuations that are the focus of monetary policymakers and researchers: policy objectives normally are phrased in terms of stabilizing fluctuations around trends or "potential."
The second finding concerns lessons for policymakers. The analysis supports the idea that monetary policy should focus less on business cycle stabilization and more on ensuring that inflation expectations are anchored and that the long-term GDP trend is not disturbed. Monetary policy also should take into account that unemployment is driven by medium-term factors that economists — using modern macroeconomic models — don't fully understand. Some of these factors may not be appropriate for monetary policy to focus on, for example, rates of firm creation or endogenous technological progress.
Overall, the analysis contributes to a growing area of research suggesting that the notion of a cycle relevant for stabilization policy should be extended to include at least medium-term fluctuations. Temporary shocks can have long-lasting effects that traditional business cycle modeling largely abstracts from.12 Future work could therefore study time-frequency decompositions in models with such a transmission mechanism.
Similarly, the findings support the idea that what matters for monetary policy is less the short-term response of policy rates to deviations of economic activity from some benchmark but rather the credible anchoring of inflation expectations. Typical analyses of monetary policy mask the effects of policies on cycles of different lengths. Frequency-based optimal policy would thus be an interesting approach for policymakers to consider.
Renee Haltom is vice president and Richmond regional executive, Thomas A. Lubik is a senior advisor, and Christian Matthes is a senior economist in the Research Department at the Federal Reserve Bank of Richmond. Fabio Verona is an advisor in the Monetary Policy and Research Department at the Bank of Finland.
1
Two common techniques are the Hodrick-Prescott filter and the Beveridge and Nelson decomposition. The Beveridge and Nelson approach rests on the idea that trends are identified as long-run forecasts once temporary fluctuations have abated. See Stephen Beveridge and Charles R. Nelson, "A New Approach to Decomposition of Economic Time Series into Permanent and Transitory Components with Particular Attention to Measurement of the 'Business Cycle,'" Journal of Monetary Economics, 1981, vol. 7, no. 2, pp. 151–174.
2
See Diego Comin and Mark Gertler, "Medium-Term Business Cycles," American Economic Review, June 2006, vol. 96, no. 3, pp. 523–551.
3
Thomas A. Lubik, Christian Matthes, and Fabio Verona, "Assessing U.S. Aggregate Fluctuations across Time and Frequencies," Federal Reserve Bank of Richmond Working Paper No. 19-06, February 2019.
4
See Mark W. Watson, "Measures of Fit for Calibrated Models," Journal of Political Economy, December 1993, vol. 101, no. 6, pp. 1011–1041.
5
See Alexei Onatski and Noah Williams, "Modeling Model Uncertainty," Journal of the European Economic Association, September 2003, vol. 1, no. 5, pp. 1087–1122.
6
See William A. Brock, Steven N. Durlauf, James M. Nason, and Giacomo Rondina, "Simple versus Optimal Rules as Guides to Policy," Journal of Monetary Economics, July 2007, vol. 54, no. 5, pp 1372–1396.
7
See William A. Brock, Steven N. Durlauf, and Giacomo Rondina, "Design Limits and Dynamic Policy Analysis," Journal of Economic Dynamics and Control, December 2013, vol. 37, no. 12, pp. 2710–2728.
8
James B. Ramsey and Camille Lampart offered the first papers in applying wavelet filtering methods in economics. See Ramsey and Lampart, "The Decomposition of Economic Relationships by Time Scale Using Wavelets: Expenditure and Income," Studies in Nonlinear Dynamics & Econometrics, April 1998, vol. 3, no. 1, article 2; and Ramsey and Lampart, "Decomposition of Economic Relationships by Timescale Using Wavelets: Money and Income," Macroeconomic Dynamics, March 1998, vol. 2, no. 1, pp. 49–71.
9
The authors' research also continues and contributes to the debate about the use of detrending methods in macroeconomics. Detrending is necessary since many empirical methods require the underlying data series to be "stationary" — that is, stable — and thereby require a filter to remove trending components. However, as research by Fabio Canova has demonstrated, different detrending methods extract different information from the underlying data series. This means stylized facts change depending on which detrending method is used. See Fabio Canova, "Detrending and Business Cycle Facts: A User's Guide," Journal of Monetary Economics, May 1998, vol. 41, no. 3, pp. 533–540.
10
A subset is discussed in this Economic Brief; see Lubik, Matthes, and Verona (2019) for additional findings.
11
Though not discussed here, Lubik, Matthes, and Verona (2019) also evaluate whether standard dynamic stochastic general equilibrium (DSGE) models can capture the different cycles of each macroeconomic variable under consideration. They find that DSGE models do a good job of describing short- and long-term fluctuations but do less well at medium-term frequencies.
12
This idea is discussed further in Lubik, Matthes, and Verona (2019).
This article may be photocopied or reprinted in its entirety. Please credit the authors, source, and the Federal Reserve Bank of Richmond and include the italicized statement below.
Views expressed in this article are those of the authors and not necessarily those of the Federal Reserve Bank of Richmond or the Federal Reserve System.
Subscribe to Economic Brief
Receive a notification when Economic Brief is posted online.
Contact Us