Searching for Soft Spots in Unemployment Rates
While a number of economic indicators — such as the Richmond Fed Manufacturing Index and real retail sales — have pointed to a recent slowdown in economic activity, June's 3.6 percent unemployment rate suggests economic activity remains robust. But what do indicators that specifically gauge recession probabilities suggest?
One such metric is the Sahm recession indicator. This is named after economist Claudia Sahm, formerly of the Federal Reserve Board (though it should be noted that similar metrics have been in use prior to her work). This indicator reflects the difference between the three-month moving average of the headline unemployment rate and the lowest three-month average unemployment rate in the previous 12 months. According to this metric, the economy is likely to be in a recession when this difference is 0.5 percentage points or greater. As of June, the indicator was at 0.
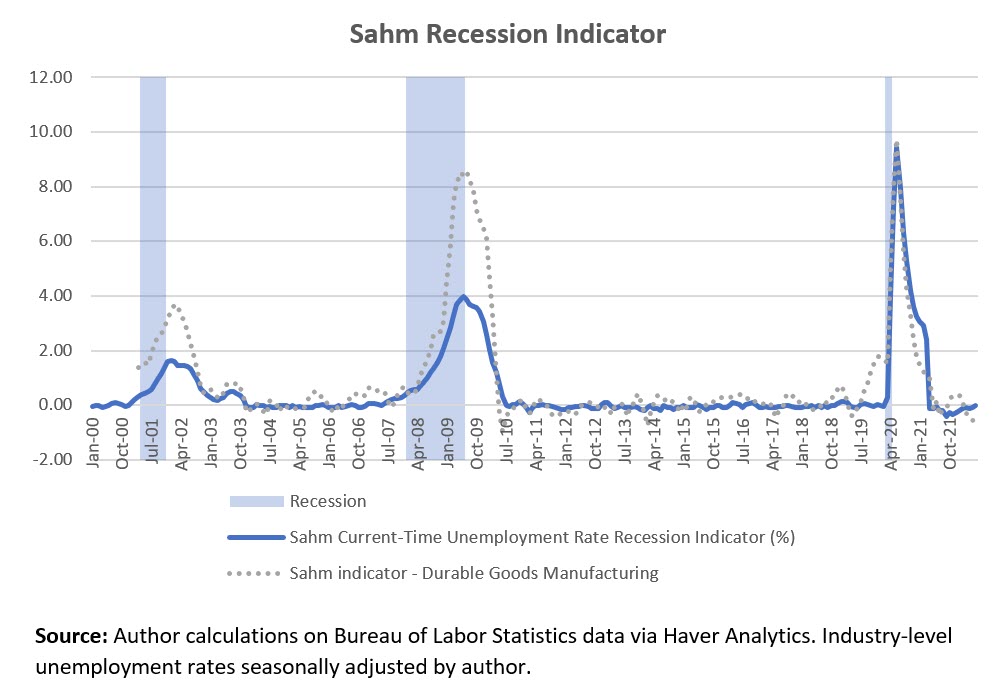
Figure 1 below plots the Sahm recession indicator over time (in the solid blue line), showing how the metric jumps upward during recessions.
But an economy in the process of slowing down may do so unevenly across sectors. This slowdown may manifest itself initially by households pulling back on big-ticket purchases, in which case sales of durable goods like automobiles and large home appliances would fall before other economic data indicate recessionary pressures. In fact, the Richmond Fed Manufacturing Index has been found to be a timely leading indicator for overall economic activity despite its focus on one sector.
Suppose the Sahm indicator can be applied at the industry level, allowing us to generate measures of industry-level recessions (such as a "manufacturing recession" or "food services recession"). While a slowdown in any one industry doesn't necessarily translate into a broad recession — which is about a slowdown across a wide range of data series — breaking out unemployment data by industry can still shed light on where and for whom the narrative of a downturn may be most relevant and visible.
For example, in Figure 1, the gray dotted line shows the Sahm recession indicator applied to unemployment in durable goods manufacturing, using industry-level unemployment rates provided by the Bureau of Labor Statistics. Frequently, this metric rises without signaling an economywide recession, indicating that the "danger" threshold at the industry level might be higher than the 0.5 percentage point threshold used for aggregate unemployment.
However, in the past three recessions, it appears the Sahm recession indicator for durable goods manufacturing rises faster than the aggregate indicator, suggesting that the industry-level measure might also be a leading indicator for economic activity. Assuming this is true, other industry-level unemployment rates might contain insights for where an economic slowdown may be emerging.
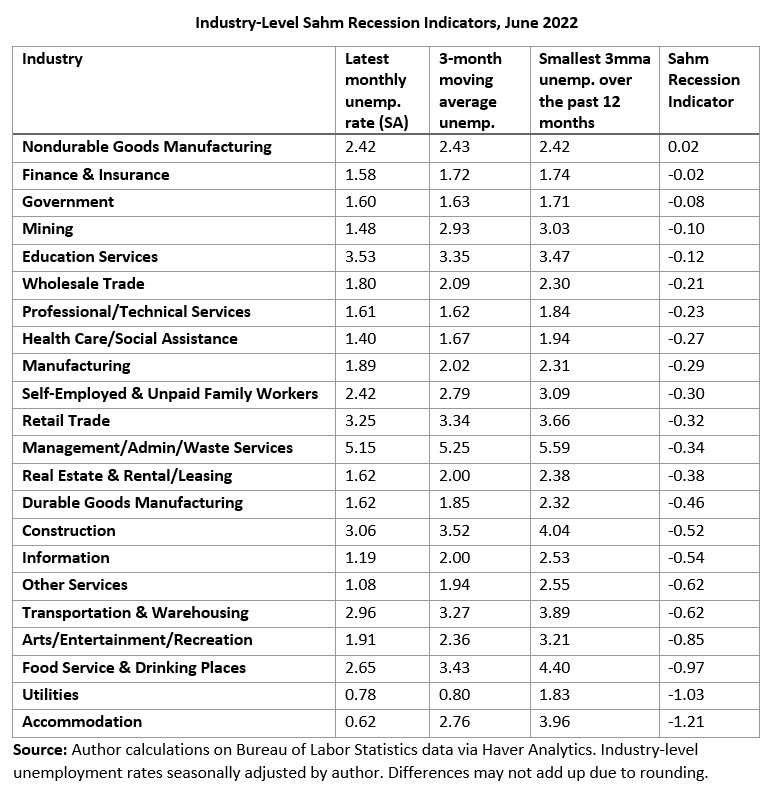
In Table 1 below, we apply the Sahm recession indicator to the industry-level unemployment rates contained in June's employment situation report. According to the last column, across all industries except nondurable goods manufacturing, the latest three-month moving average unemployment rate remains below its lowest value during the previous 12 months. In nondurable goods manufacturing, there is a slight positive difference, but still below the 0.5-percentage-point threshold for the broad unemployment rate that the Sahm indicator would consider to be indicative of a recession. As mentioned earlier, at the industry level, the relevant critical value that would trigger a recession warning might be even higher than 0.5 percentage points. For now, we appear to be below that critical value in every industry.
These results indicate that, based on June's employment report, underlying economic activity remains broadly strong across sectors. This is in line with what you'd expect in a month where headline Consumer Price Index inflation was above 9 percent and core CPI inflation nearly 6 percent year over year.
Views expressed in this article are those of the author and not necessarily those of the Federal Reserve Bank of Richmond or the Federal Reserve System.


