Are Services Serving Up a Wage-Price Spiral?
Macro Minute
November 15, 2022
While some aspects of today's inflation resemble the painful experiences of the 1970s, one element that so far has been missing is a wage-price spiral, which some have conjectured existed during that decade. How related are wages and prices, and does the current environment mean such a relationship has changed?
In a wage-price spiral, inflation is fed by a vicious cycle where, as the cost of living rises, workers demand higher wages to pay their bills, leading firms to increase prices even further to cover labor costs. This became a problem in the '70s for two main reasons: More workers had their wages indexed to inflation, and the central bank's lack of a credible inflation target meant there was no commonly agreed benchmark for what future inflation should look like.
But some warning signs may be emerging as the current inflationary period lasts longer than expected. The most recent Beige Book reported that "some businesses said elevated inflation and higher costs of living were pushing wages up, coupled with upward pressure from labor market tightness." In other words, higher prices may be feeding into higher wages.
To have a full wage-price spiral, however, the effect has to run in both directions: Not only should higher prices feed into higher wages, but higher wages should drive higher prices. We'll explore whether there's evidence for this kind of two-way feedback loop between inflation and wage growth. In particular, we'll look at this relationship over time and see whether it has changed during today's episode of high inflation.
To test this relationship, we can perform what is known as a Granger causality test, which looks at whether past observations of, say, time-series variable X can explain current movements in time-series variable Y. If so, then X "Granger-causes" Y.
Running a Granger-causality will test to see if past observations of consumer price inflation are associated with current changes in wages — measured by the Bureau of Labor Statistics' Employer Cost Index for wages and salaries — and vice versa. Finding a Granger causal relationship in both directions might raise red flags in terms of an emerging wage-price spiral.
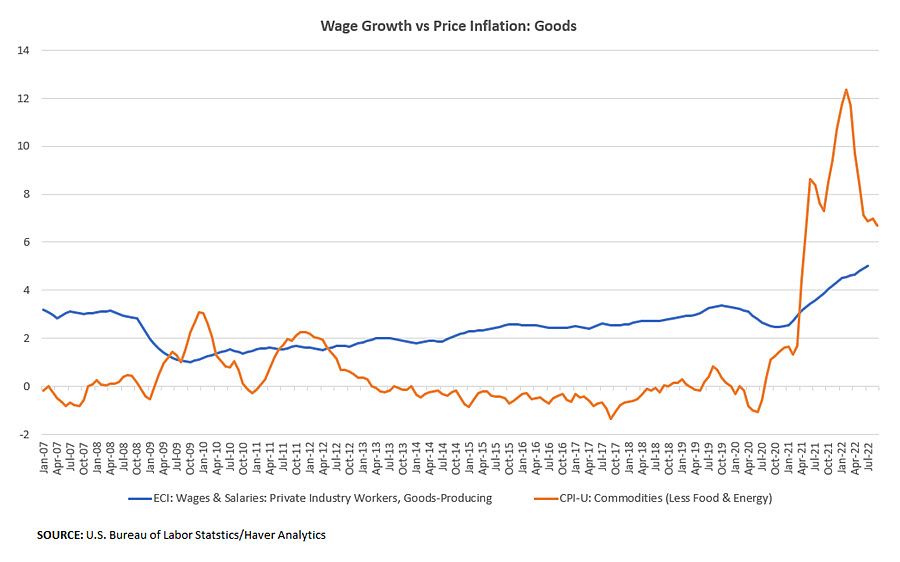
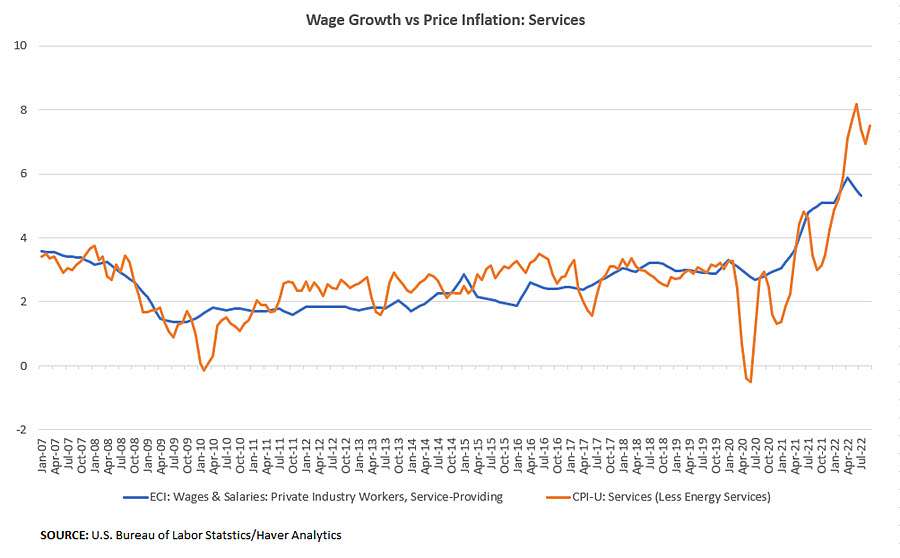
In running the procedure, we look at the wage-price dynamics in goods-producing and services-providing industries separately. Figures 1 and 2 below plot year-over-year increases in the Employment Cost Index for private sector wages and services against core CPI inflation, broken out for both goods and services. While there appears to be a positive correlation in both figures, the relationship looks particularly strong for the services industries in Figure 2.
To formally test for Granger causality, we set up a vector autoregression model (VAR) containing the quarter-over-quarter annualized percent changes for both sets of variables, using data that extends to the first quarter of 2000. The VAR relates each variable (either ECI or CPI) to its own lag, as well as the lag of the other variable. Note that the true relationship between wages and prices is likely more complex than the simple model we run here — for example, it may include more lags of data beyond the immediately preceding quarter. For today, however, we'll look at the first lag as a useful heuristic describing the relationship of the present with the past. Table 1 shows results for the services-providing industries.
| CPI (Services) (Pre-Pandemic) |
ECI (Services) (Pre-Pandemic) |
CPI (Services) (Total) |
ECI (Services) (Total) |
|
|---|---|---|---|---|
| CPIt-1 | .5916*** (.0952) |
.5414*** (.1257) |
.4896*** (.1060) |
.4014*** (.1133) |
| ECIt-1 | .1641. (.0834) |
.1385 (.1101) |
.2790** (.0995) |
.3002** (.1064) |
|
Significance codes: < .001 '***' <.01 '**' <.05 '*' <.1 '.' Standard errors in parentheses. Source: Authors' analysis of BLS data via Haver Analytics |
||||
The first column indicates that lagged changes in services wages (ECI) did not have a statistically strong relationship with quarterly changes in the core services CPI during the pre-pandemic period (the first quarter of 2000 through the fourth quarter of 2019). There was no evidence of Granger causality running in that direction.
However, the third column indicates that the sign on the ECI variable has risen and become statistically significant if we look at the full sample (the first quarter of 2000 through the fourth quarter of 2022). Meanwhile, the second and fourth columns of Table 1 indicate that past core services inflation contributed to current wage inflation in services — a relationship that exists in both the pre-pandemic sample and the full sample. We found evidence of two-directional Granger-causality between wages and prices in services, a warning signal when it comes to an emerging wage-price spiral.
But is this problem spreading to other industries? Table 2 replicates the analysis for goods-producing industries
| CPI (Goods) (Pre-Pandemic) |
ECI (Goods) (Pre-Pandemic) |
CPI (Goods) (Total) |
ECI (Goods) (Total) |
|
|---|---|---|---|---|
| CPIt-1 | .3433** (.1095) |
-.0297 (.0632) |
.5816*** (.0905) |
.0520. (.0288) |
| ECIt-1 | -.2619 (.1732) |
.4914*** (.1000) |
.1711 (.2685) |
.6086*** (.0855) |
|
Significance codes: < .001 '***' <.01 '**' <.05 '*' <.1 '.' Standard errors in parentheses. Source: Authors' analysis of BLS data via Haver Analytics |
||||
In the first and third columns of Table 2, the ECI for goods-producing industries doesn't appear to be a statistically significant contributor to current quarterly inflation, in either the pre-pandemic sample or the full sample. Furthermore, the second and fourth columns indicate that quarterly core goods inflation doesn't have a statistically strong link with wage increases in goods-producing industries. There's no evidence of wages feeding into prices, or vice versa, for the goods industries.
While the absence of a strong bidirectional relationship in goods wages and prices is a sign that spiral-like dynamics haven't broadened through the entire economy, goods-producing industries make up only 16 percent of private-sector nonfarm payrolls, while services make up 84 percent.
As a result, FOMC policymakers in recent public statements have highlighted the need for both inflation and wage growth to return to levels consistent with the Fed's price stability mandate, as well as their determination to stop any emerging spiral from swirling out of control.
Views expressed in this article are those of the author and not necessarily those of the Federal Reserve Bank of Richmond or the Federal Reserve System.
Contact Us