Are Consumers Losing Steam?
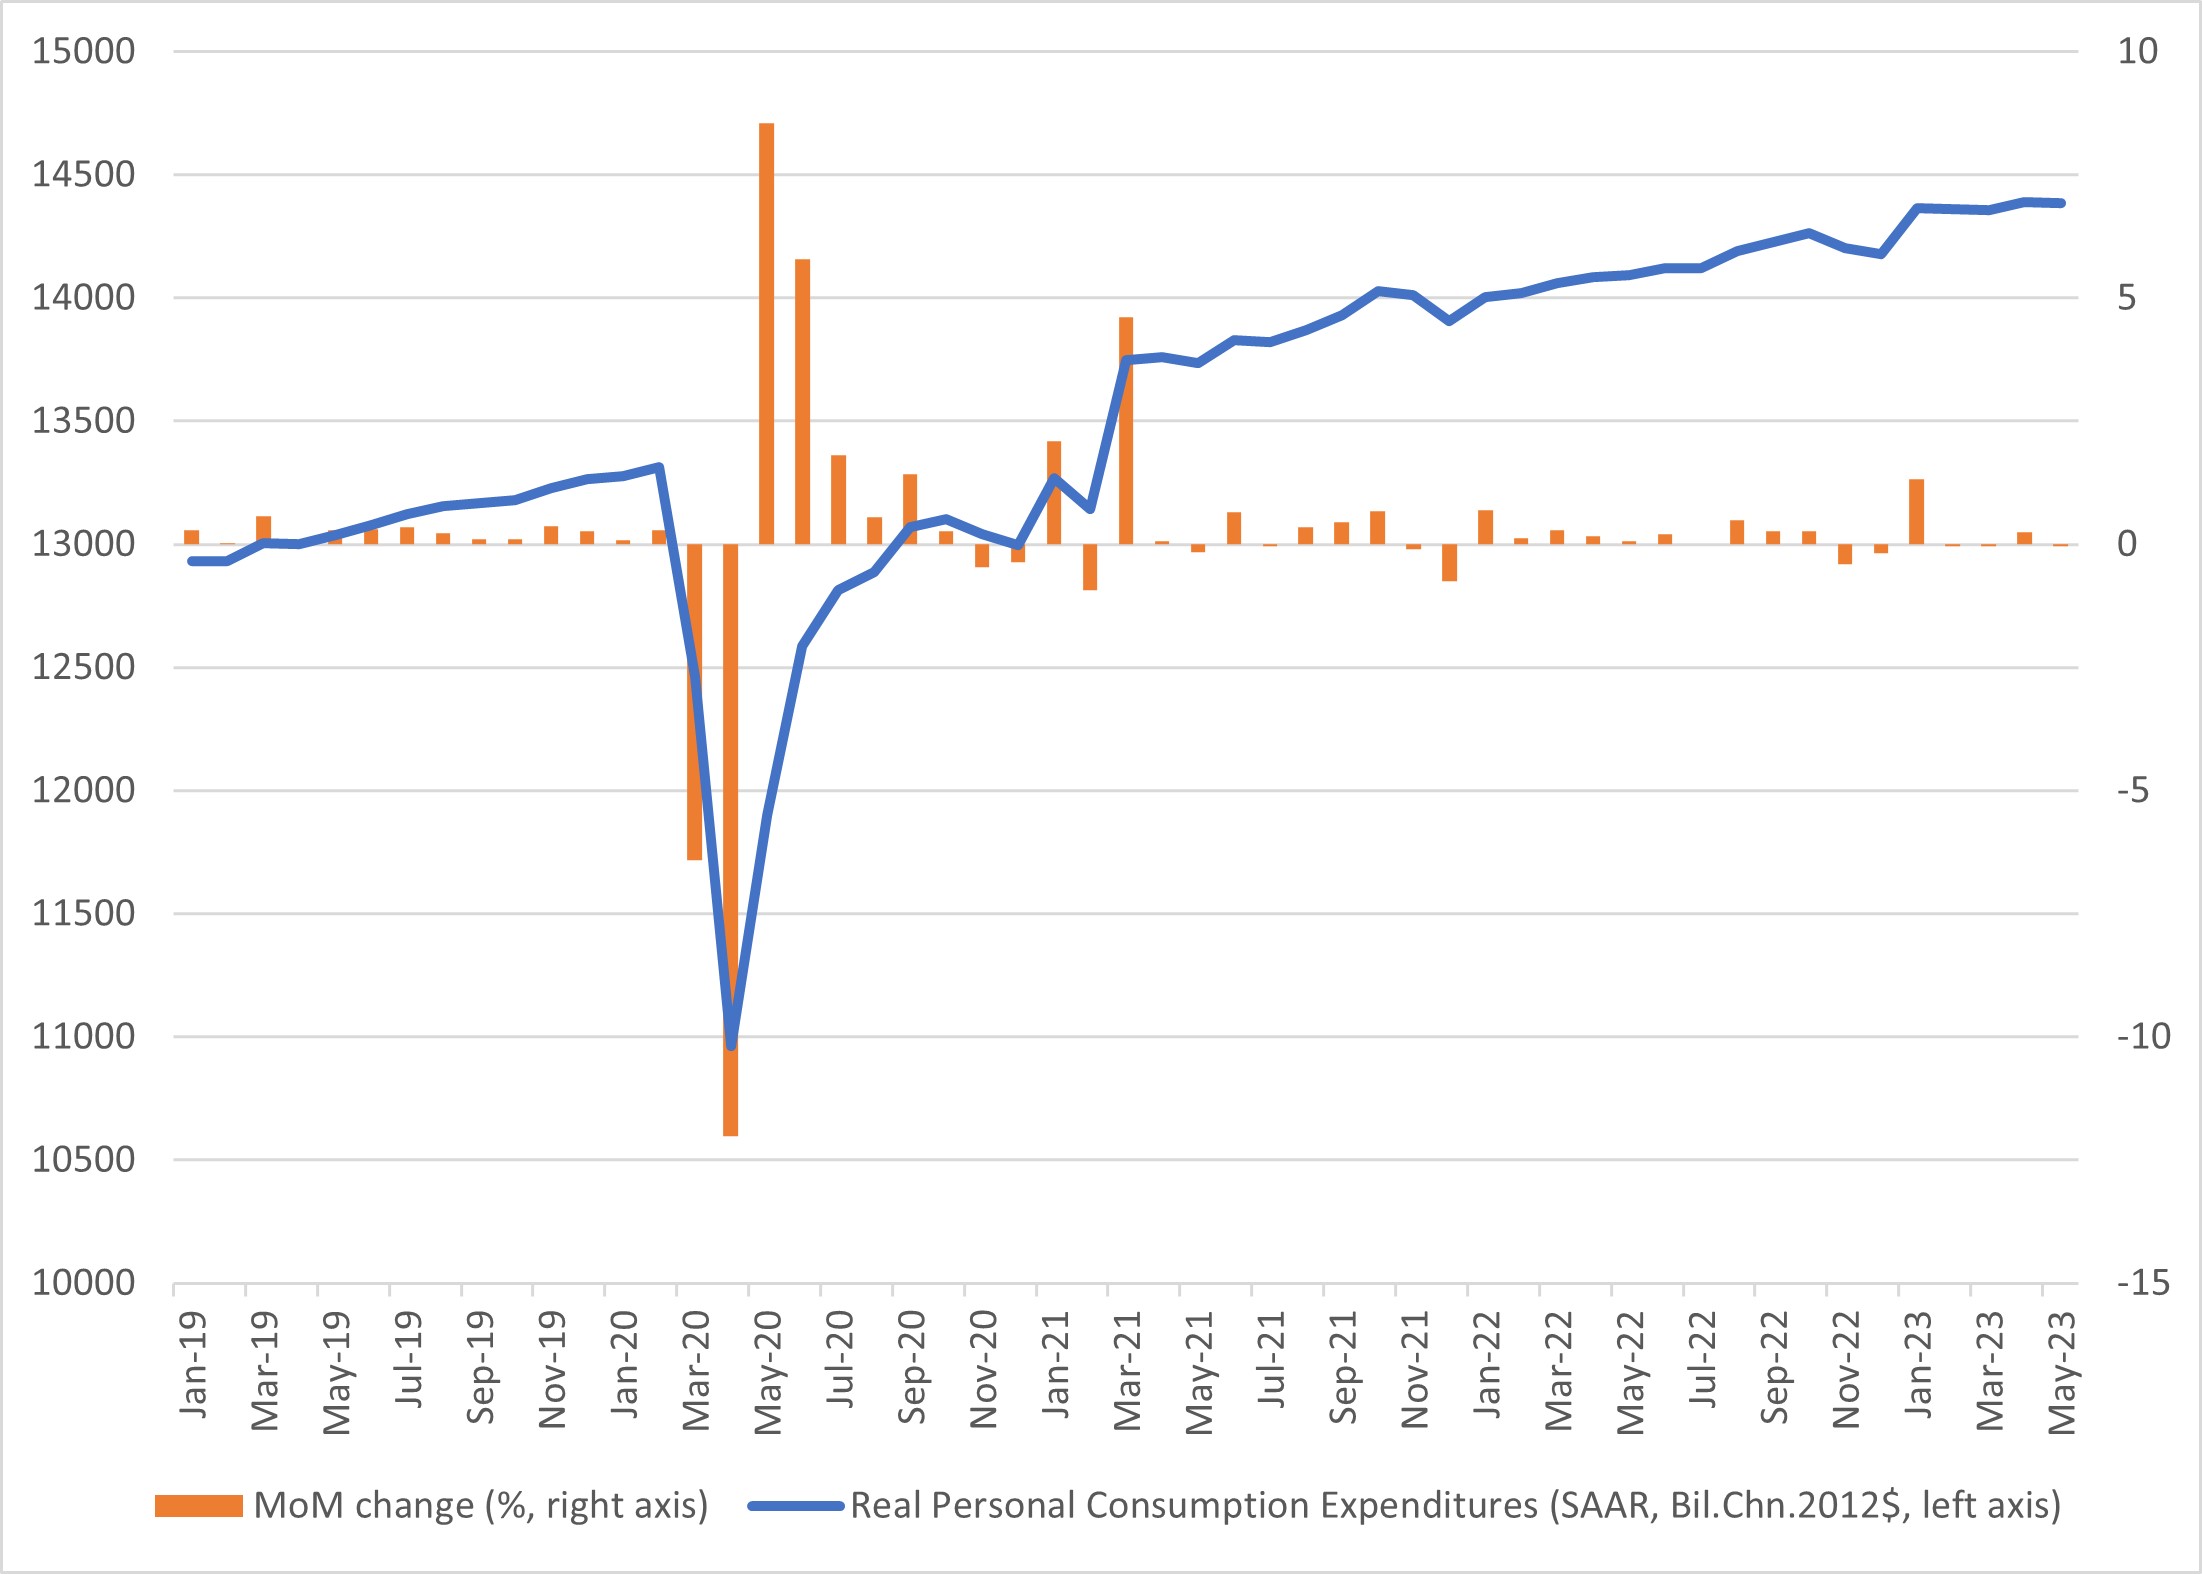
While the level of inflation-adjusted household spending remains high, recent monthly growth rates are no longer as buoyant as before. In May, real personal consumption expenditures (PCE) fell at a 0.3 percent annual rate, and as shown in Figure 1 below, three of the past four months have seen negative month-over-month growth in real PCE.
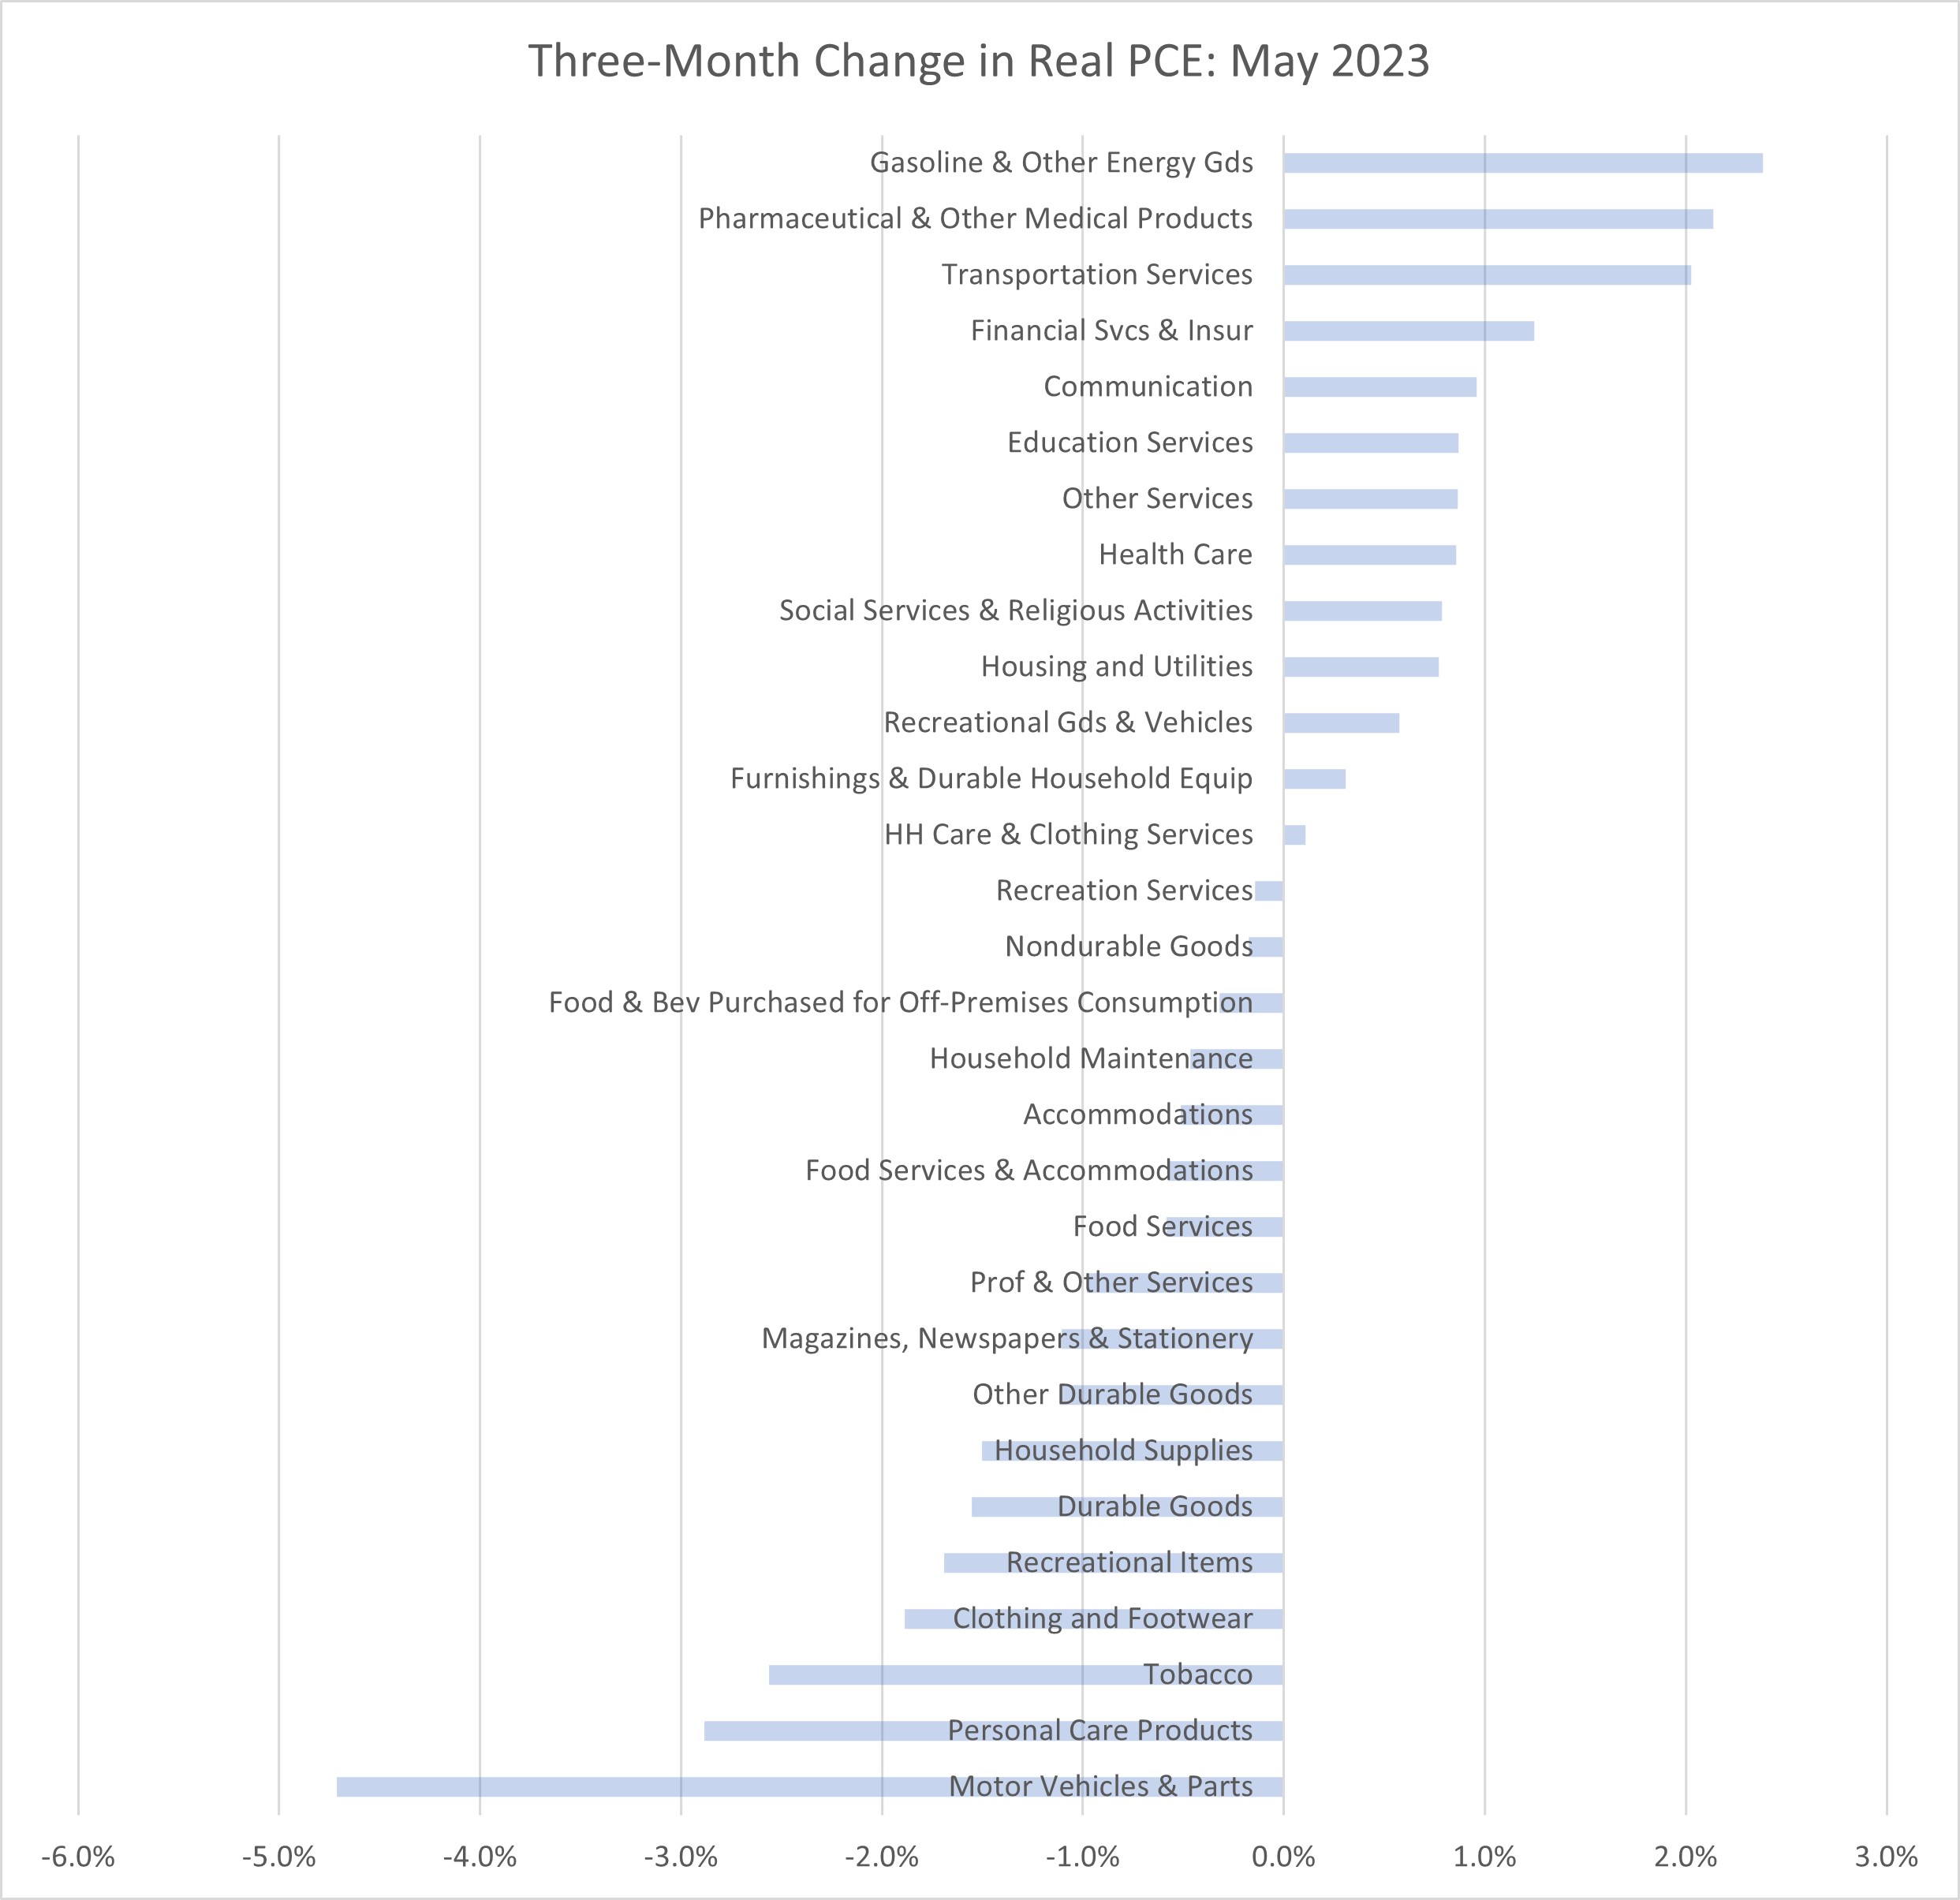
Looking across the categories where consumers are spending, it's not clear that households have tightened the belt in discretionary areas like leisure. Figure 2 below depicts the three-month change in real spending by category, indicating spending continues to grow for both necessities and discretionary items.
Over the past three months, the categories that grew include necessities like housing, gasoline and health-related goods and services, though some discretionary categories — such as transportation services and recreational goods and vehicles — also grew. Meanwhile, spending has fallen over the past three months in other discretionary areas such as motor vehicles, food services and accommodations, and recreational services and items.
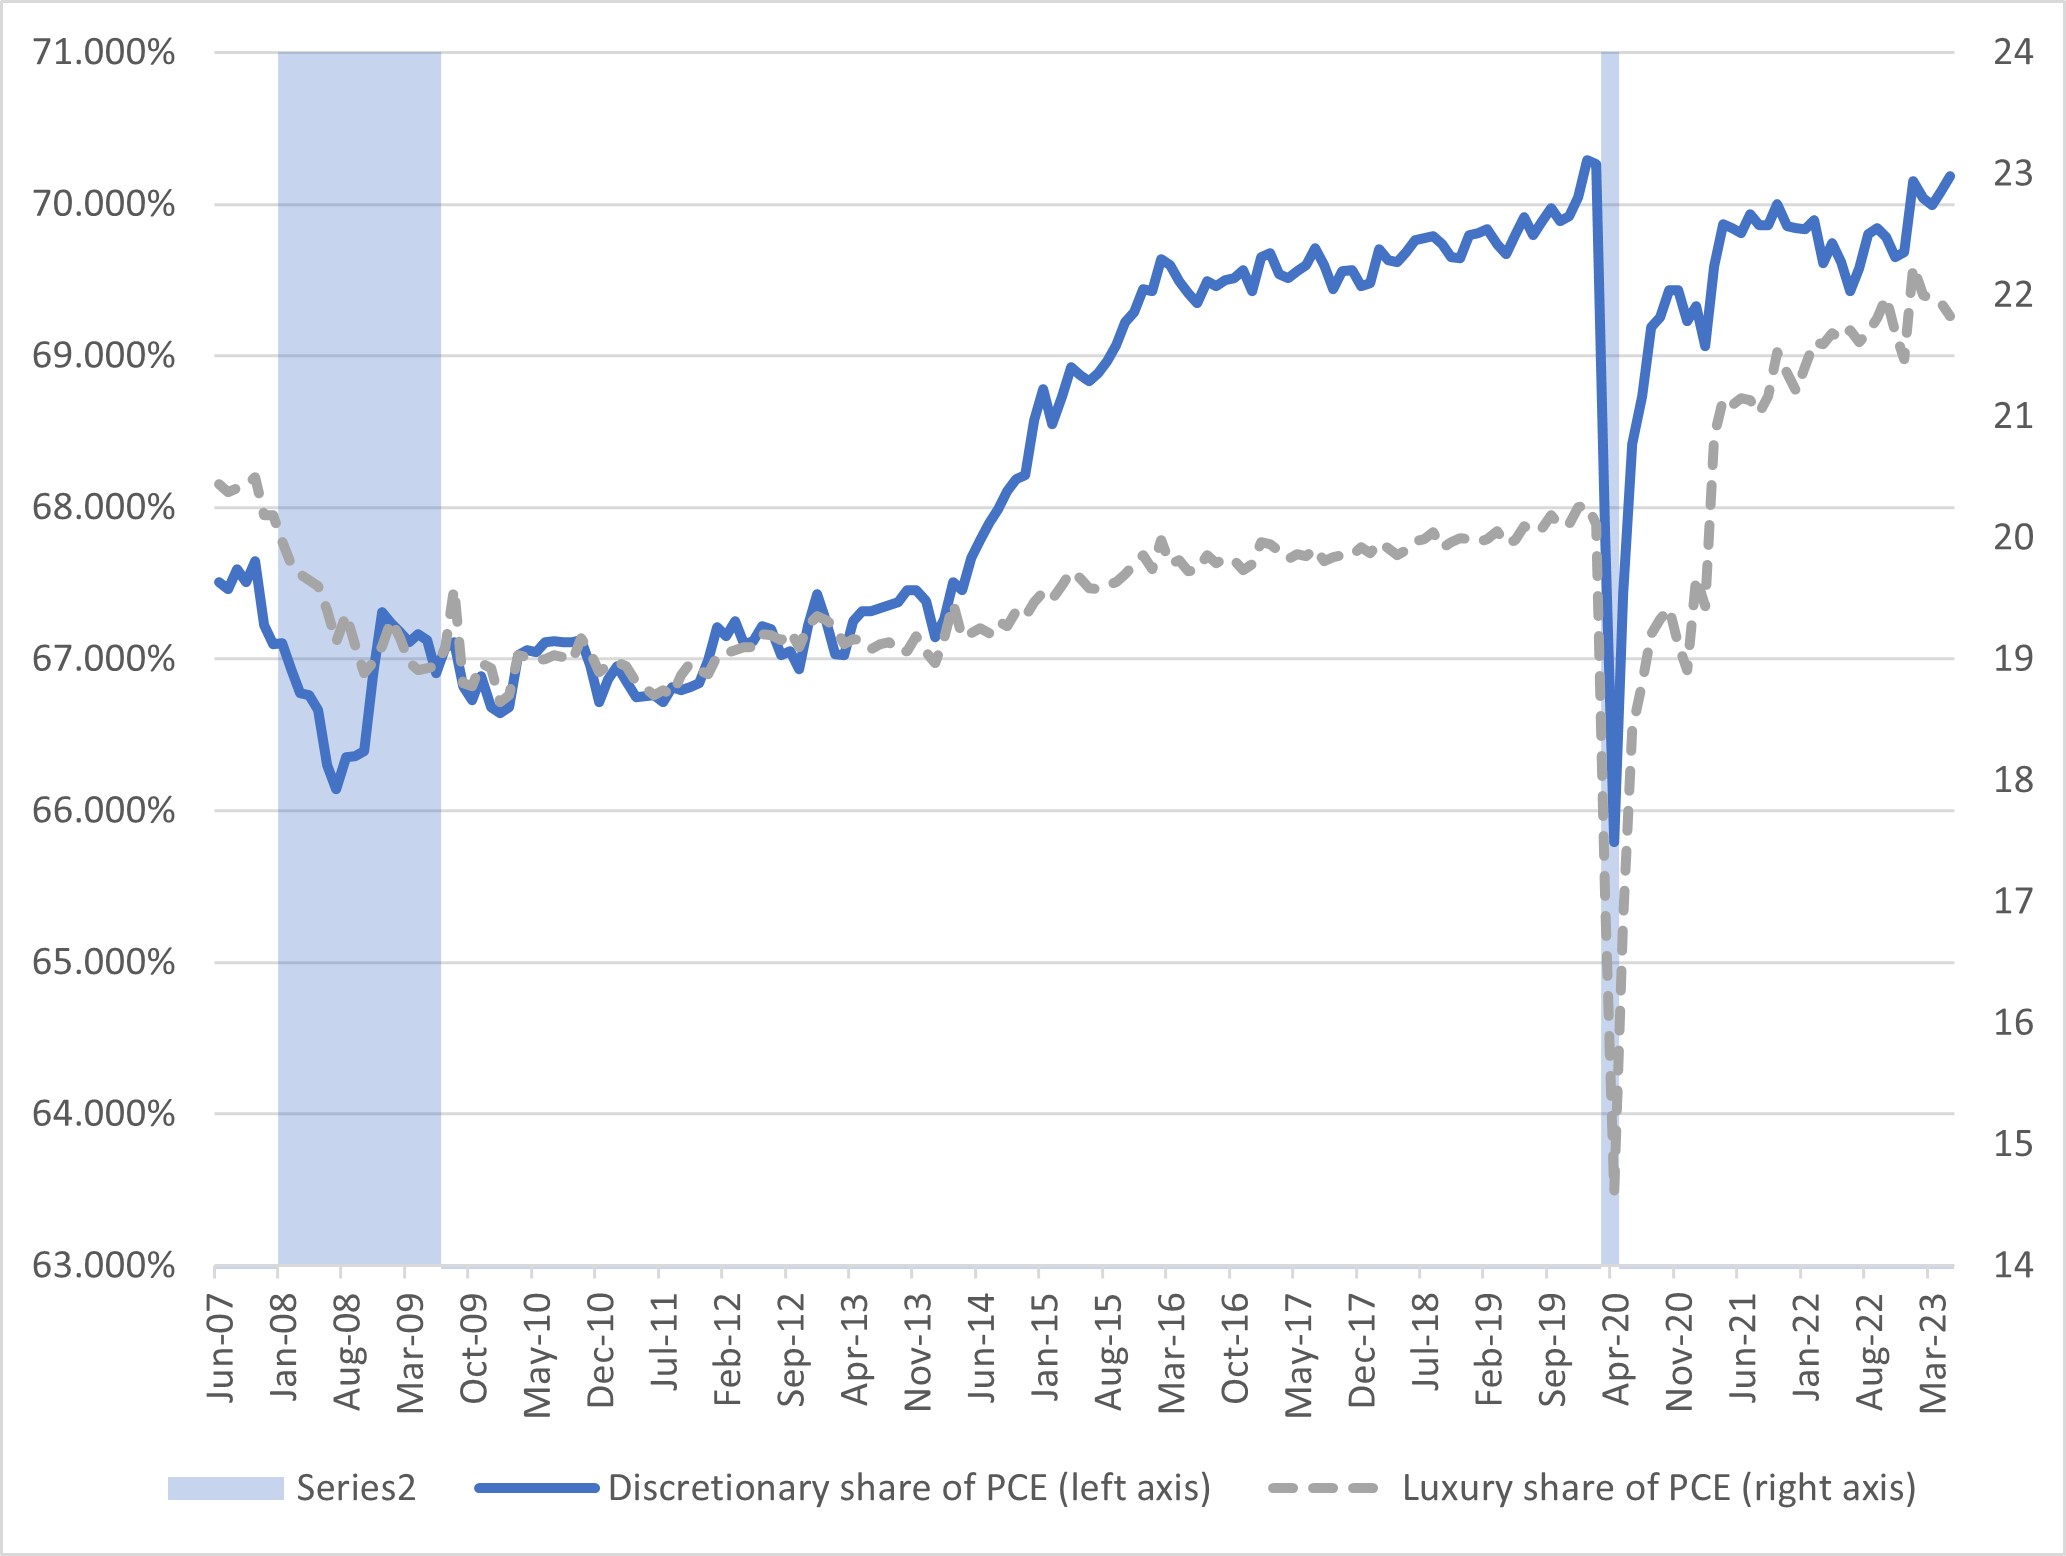
However, from a bird's-eye view, the share of spending going to discretionary categories has reached its highest level since the start of the pandemic. The blue line in Figure 3 below shows (as a share of overall PCE) one measure of the share of discretionary spending calculated as total personal consumption expenditures less gasoline and other energy goods, food and beverages purchased for off-premises consumption, clothing and footwear, and housing and utilities. In May, that share reached 70.2 percent, the highest mark since February 2020's 70.3 percent share.
Instead of trying to identify and exclude necessities from total spending, we could also explore the share of spending going to particular discretionary categories. The gray dashed line in Figure 3 below shows (again as a share of overall PCE) an alternative measure of the share of luxury spending in overall household consumption, calculated as household spending on motor vehicles and parts, recreational goods and vehicles, recreation services, food services and accommodations, net foreign travel and expenditure abroad by U.S. residents, jewelry and watches, alcoholic beverages purchased for off-premises consumption, beauty-related expenditure including cosmetics, perfumes and hairdressing salons, and laundry and dry cleaning services. While this measure is not at a post-COVID-19 high, it remains elevated versus pre-pandemic share.
The fact that households continue to prioritize luxury goods and services in their spending may indicate that they feel better off than the weak monthly growth rates of real PCE might otherwise imply. But these data come with an important caveat: These are aggregate ratios and may not necessarily reflect the experience of a given individual household. It's possible that the elevated discretionary spending we're seeing in these figures is being driven by wealthier or higher-income households, while households at the lower end are having to cut back. Even if the steam engine of consumer spending continues to sputter along, it may no longer be firing on all cylinders.
Note for our readers: Macro Minute will return August 1.
Views expressed in this article are those of the author and not necessarily those of the Federal Reserve Bank of Richmond or the Federal Reserve System.


