Dwindling Disposable Income
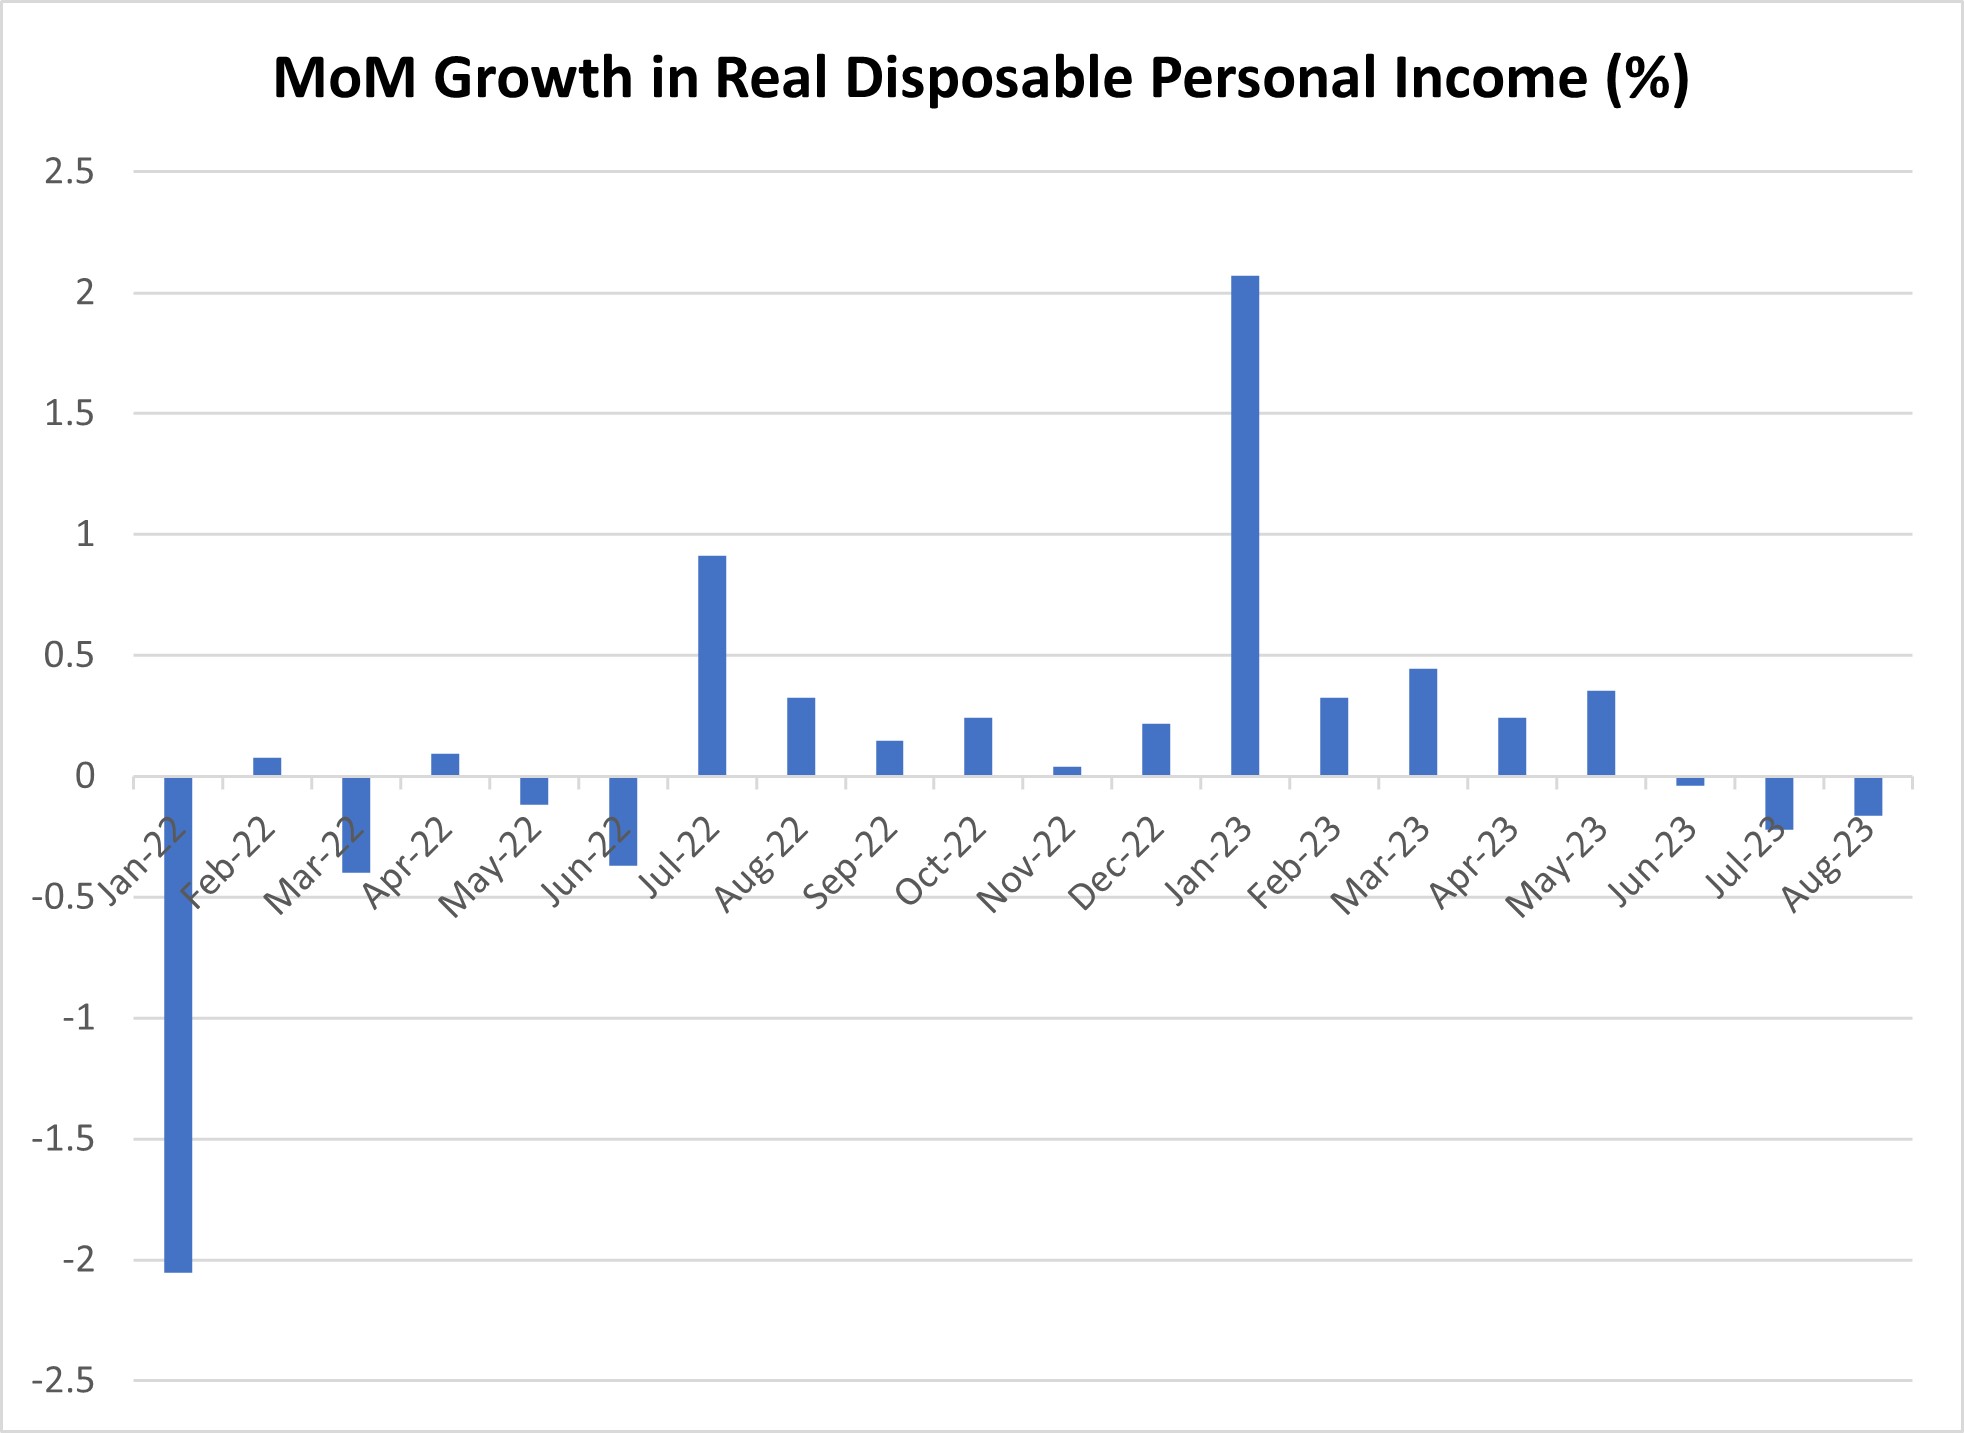
In last week's post, we discussed signs of a slowdown in household spending. Could the decline in spending reflect weaker income growth? As of August, real disposable personal income (DPI) growth has been negative for the past three months (Figure 1) following 11 consecutive months of gains. This week, I'll dive into the drivers of this decline.
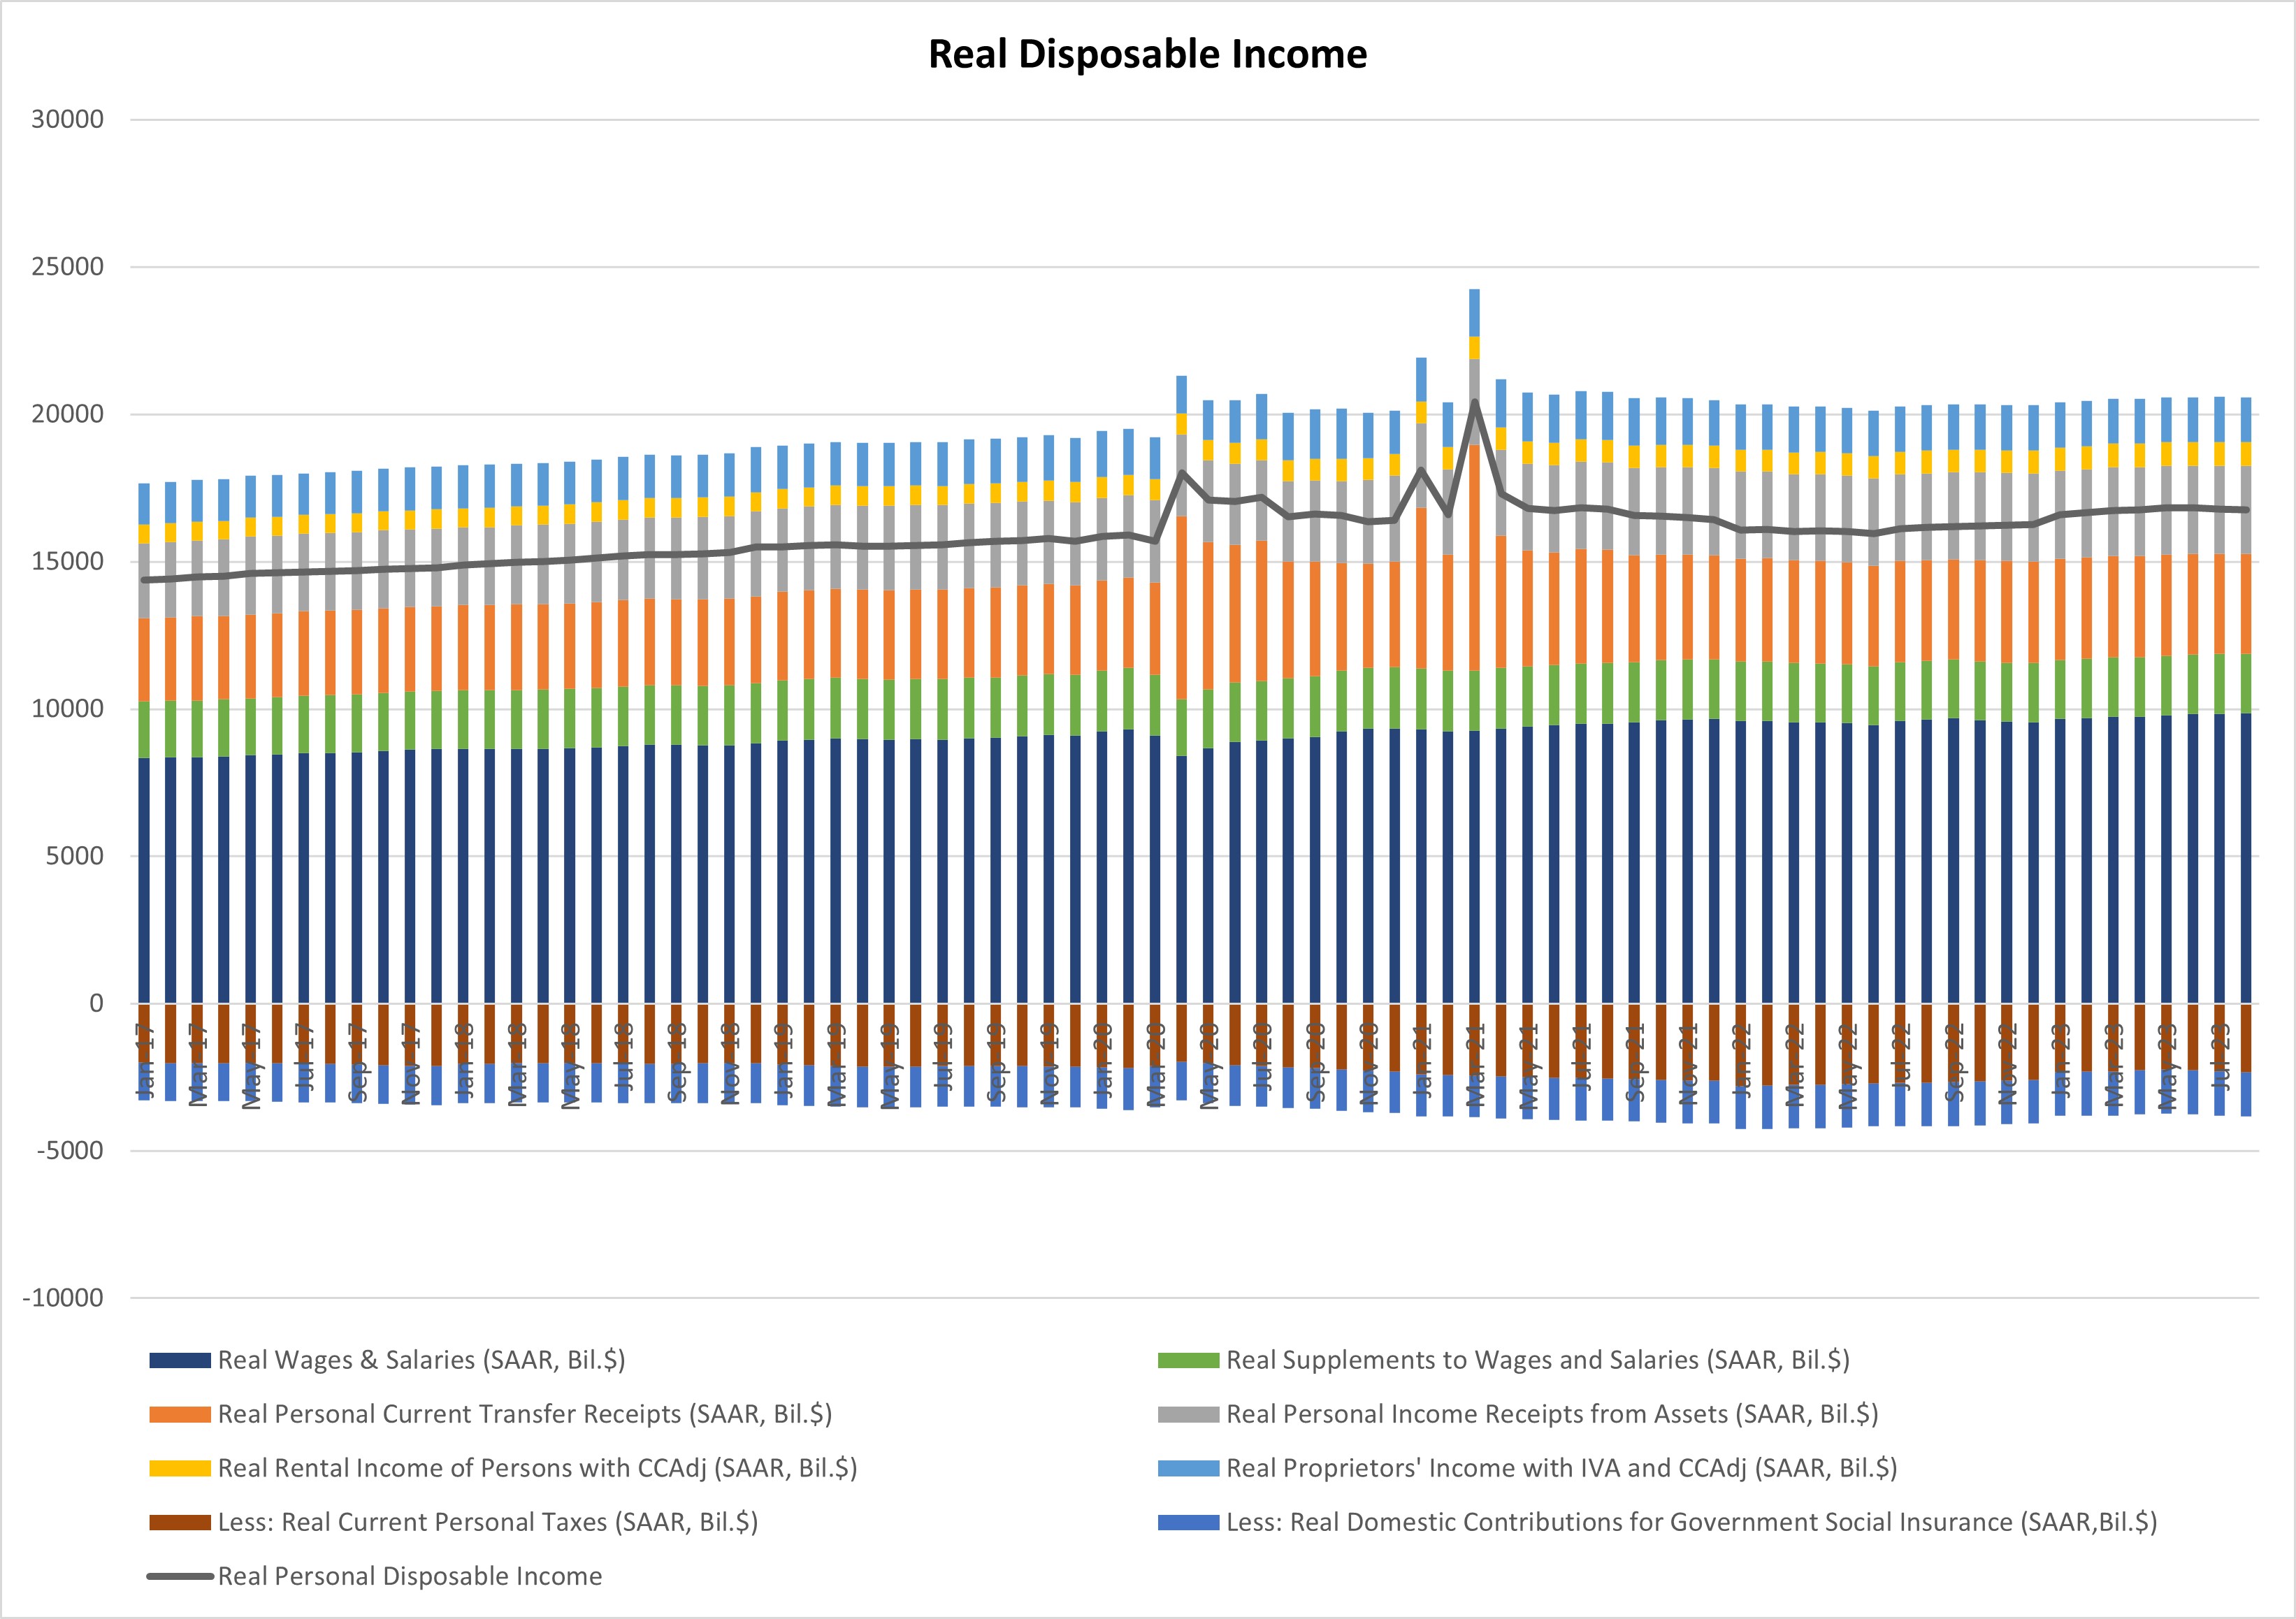
To find out what's behind this decline, I break out real DPI into its components. (See Figure 2 below.) Real disposable income can be expressed as the sum of wage and salary income, supplements to wages and salaries, current transfer receipts, asset income, rental income, and proprietors' income net of taxes and contributions to government social insurance.
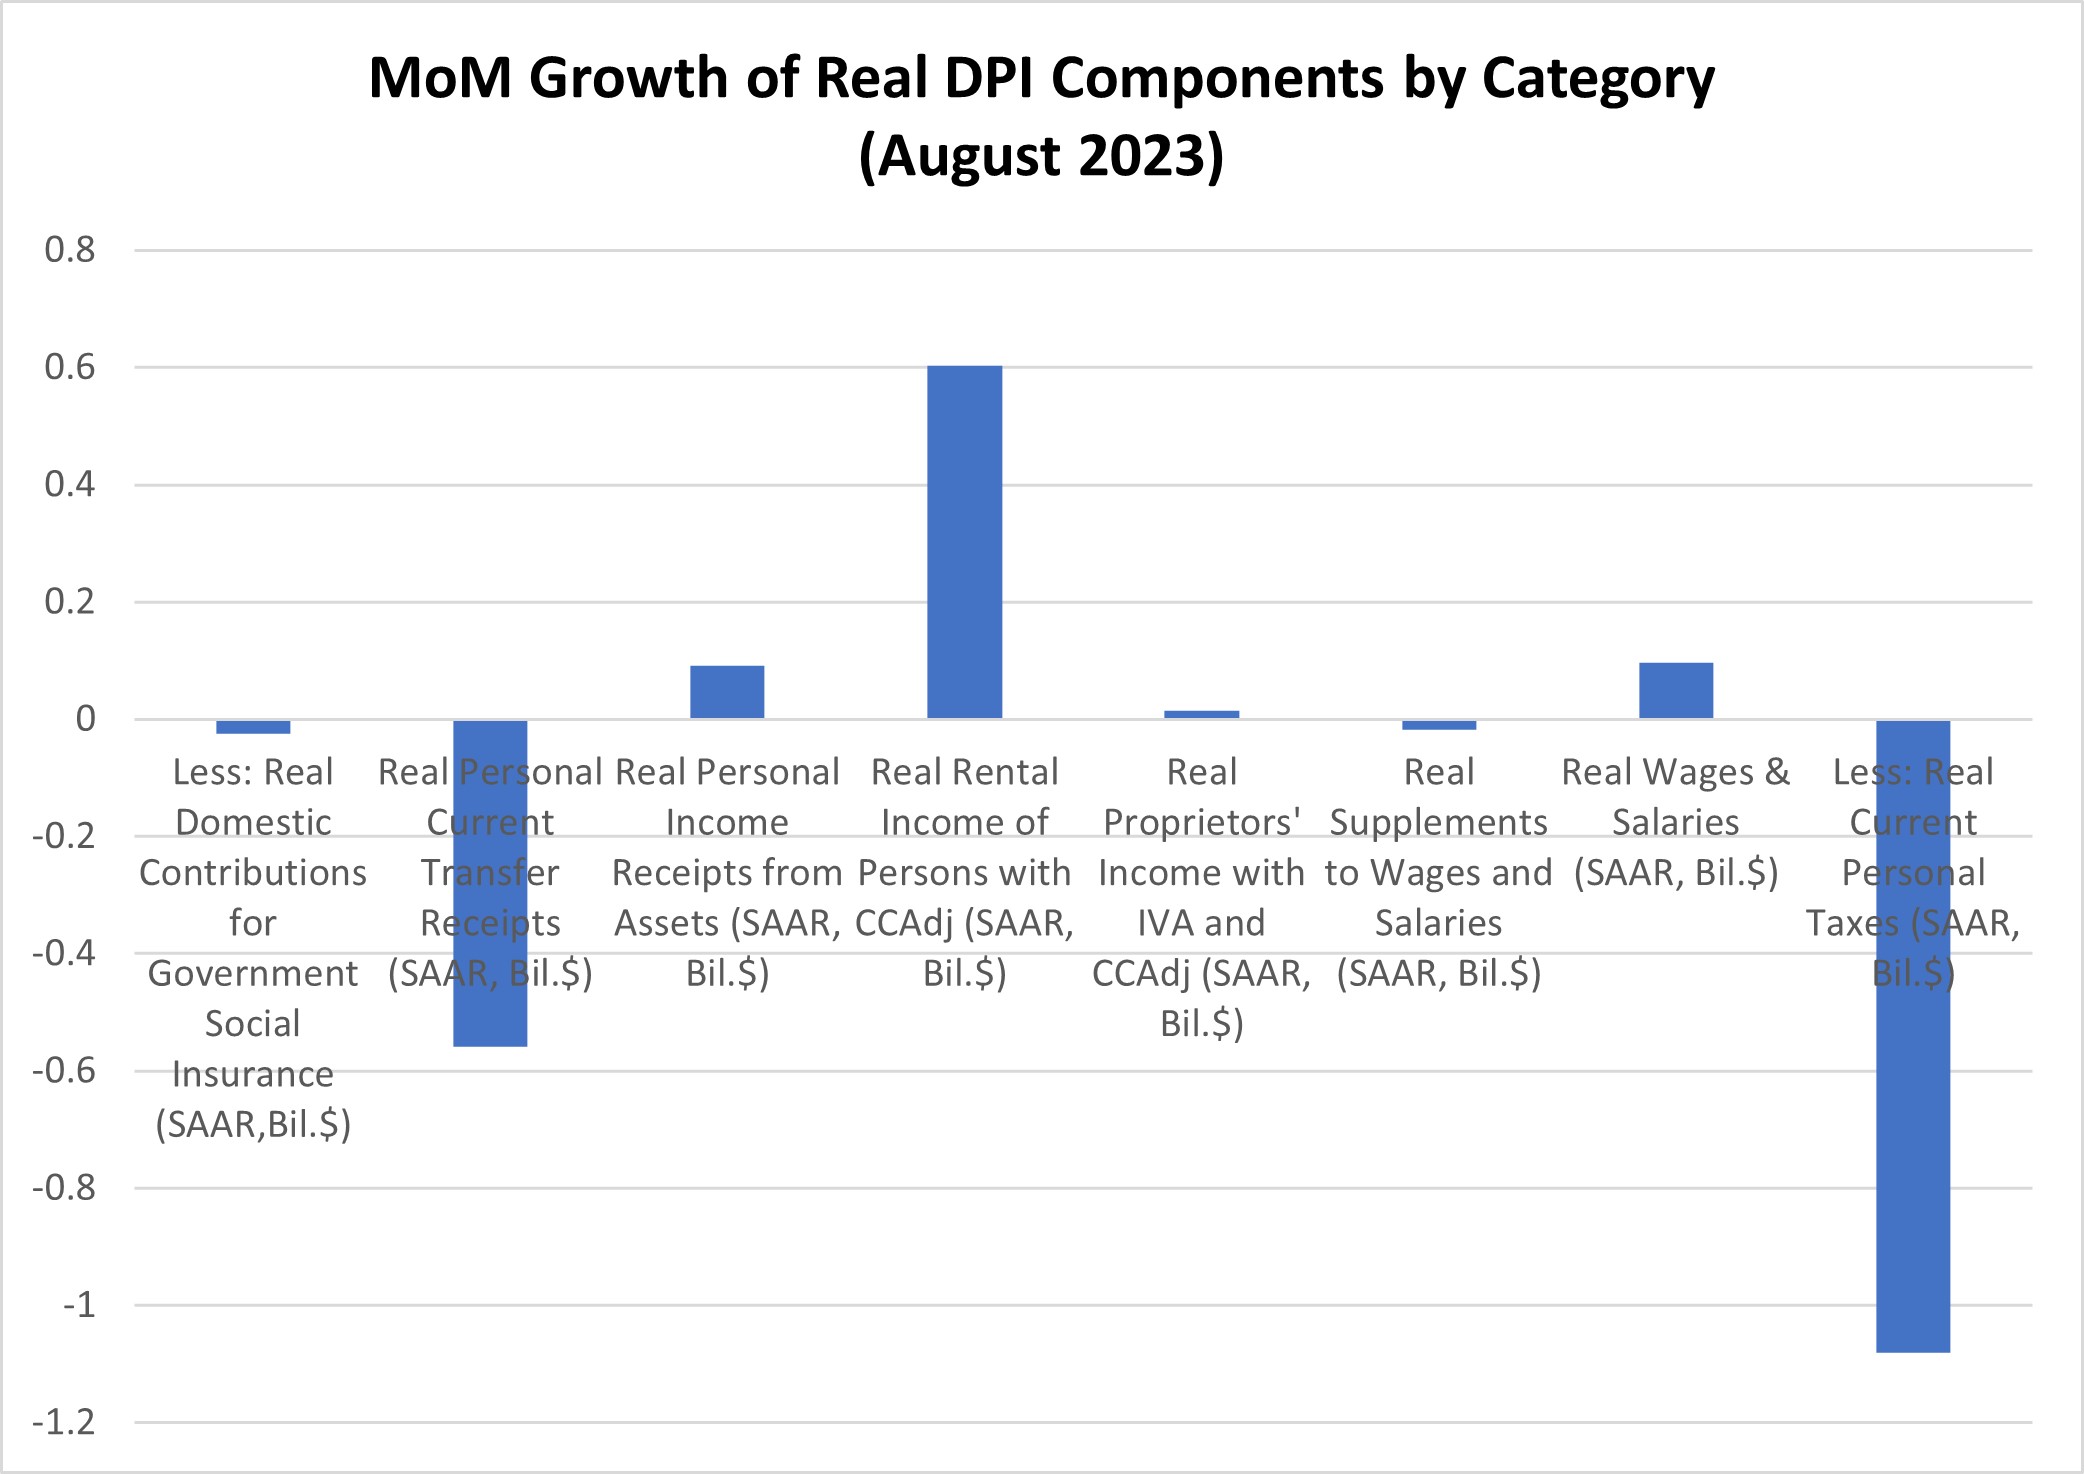
In the latest monthly reading, households continued to see growth in rental income, asset income, and wage and salary income. (See Figure 3 below.) Offsetting that growth, real DPI saw intensified headwinds from higher taxes as well as lower transfer receipts. There were also small headwinds from increased contributions to government social insurance and from a decline in employer benefits (supplements to wages and salaries).
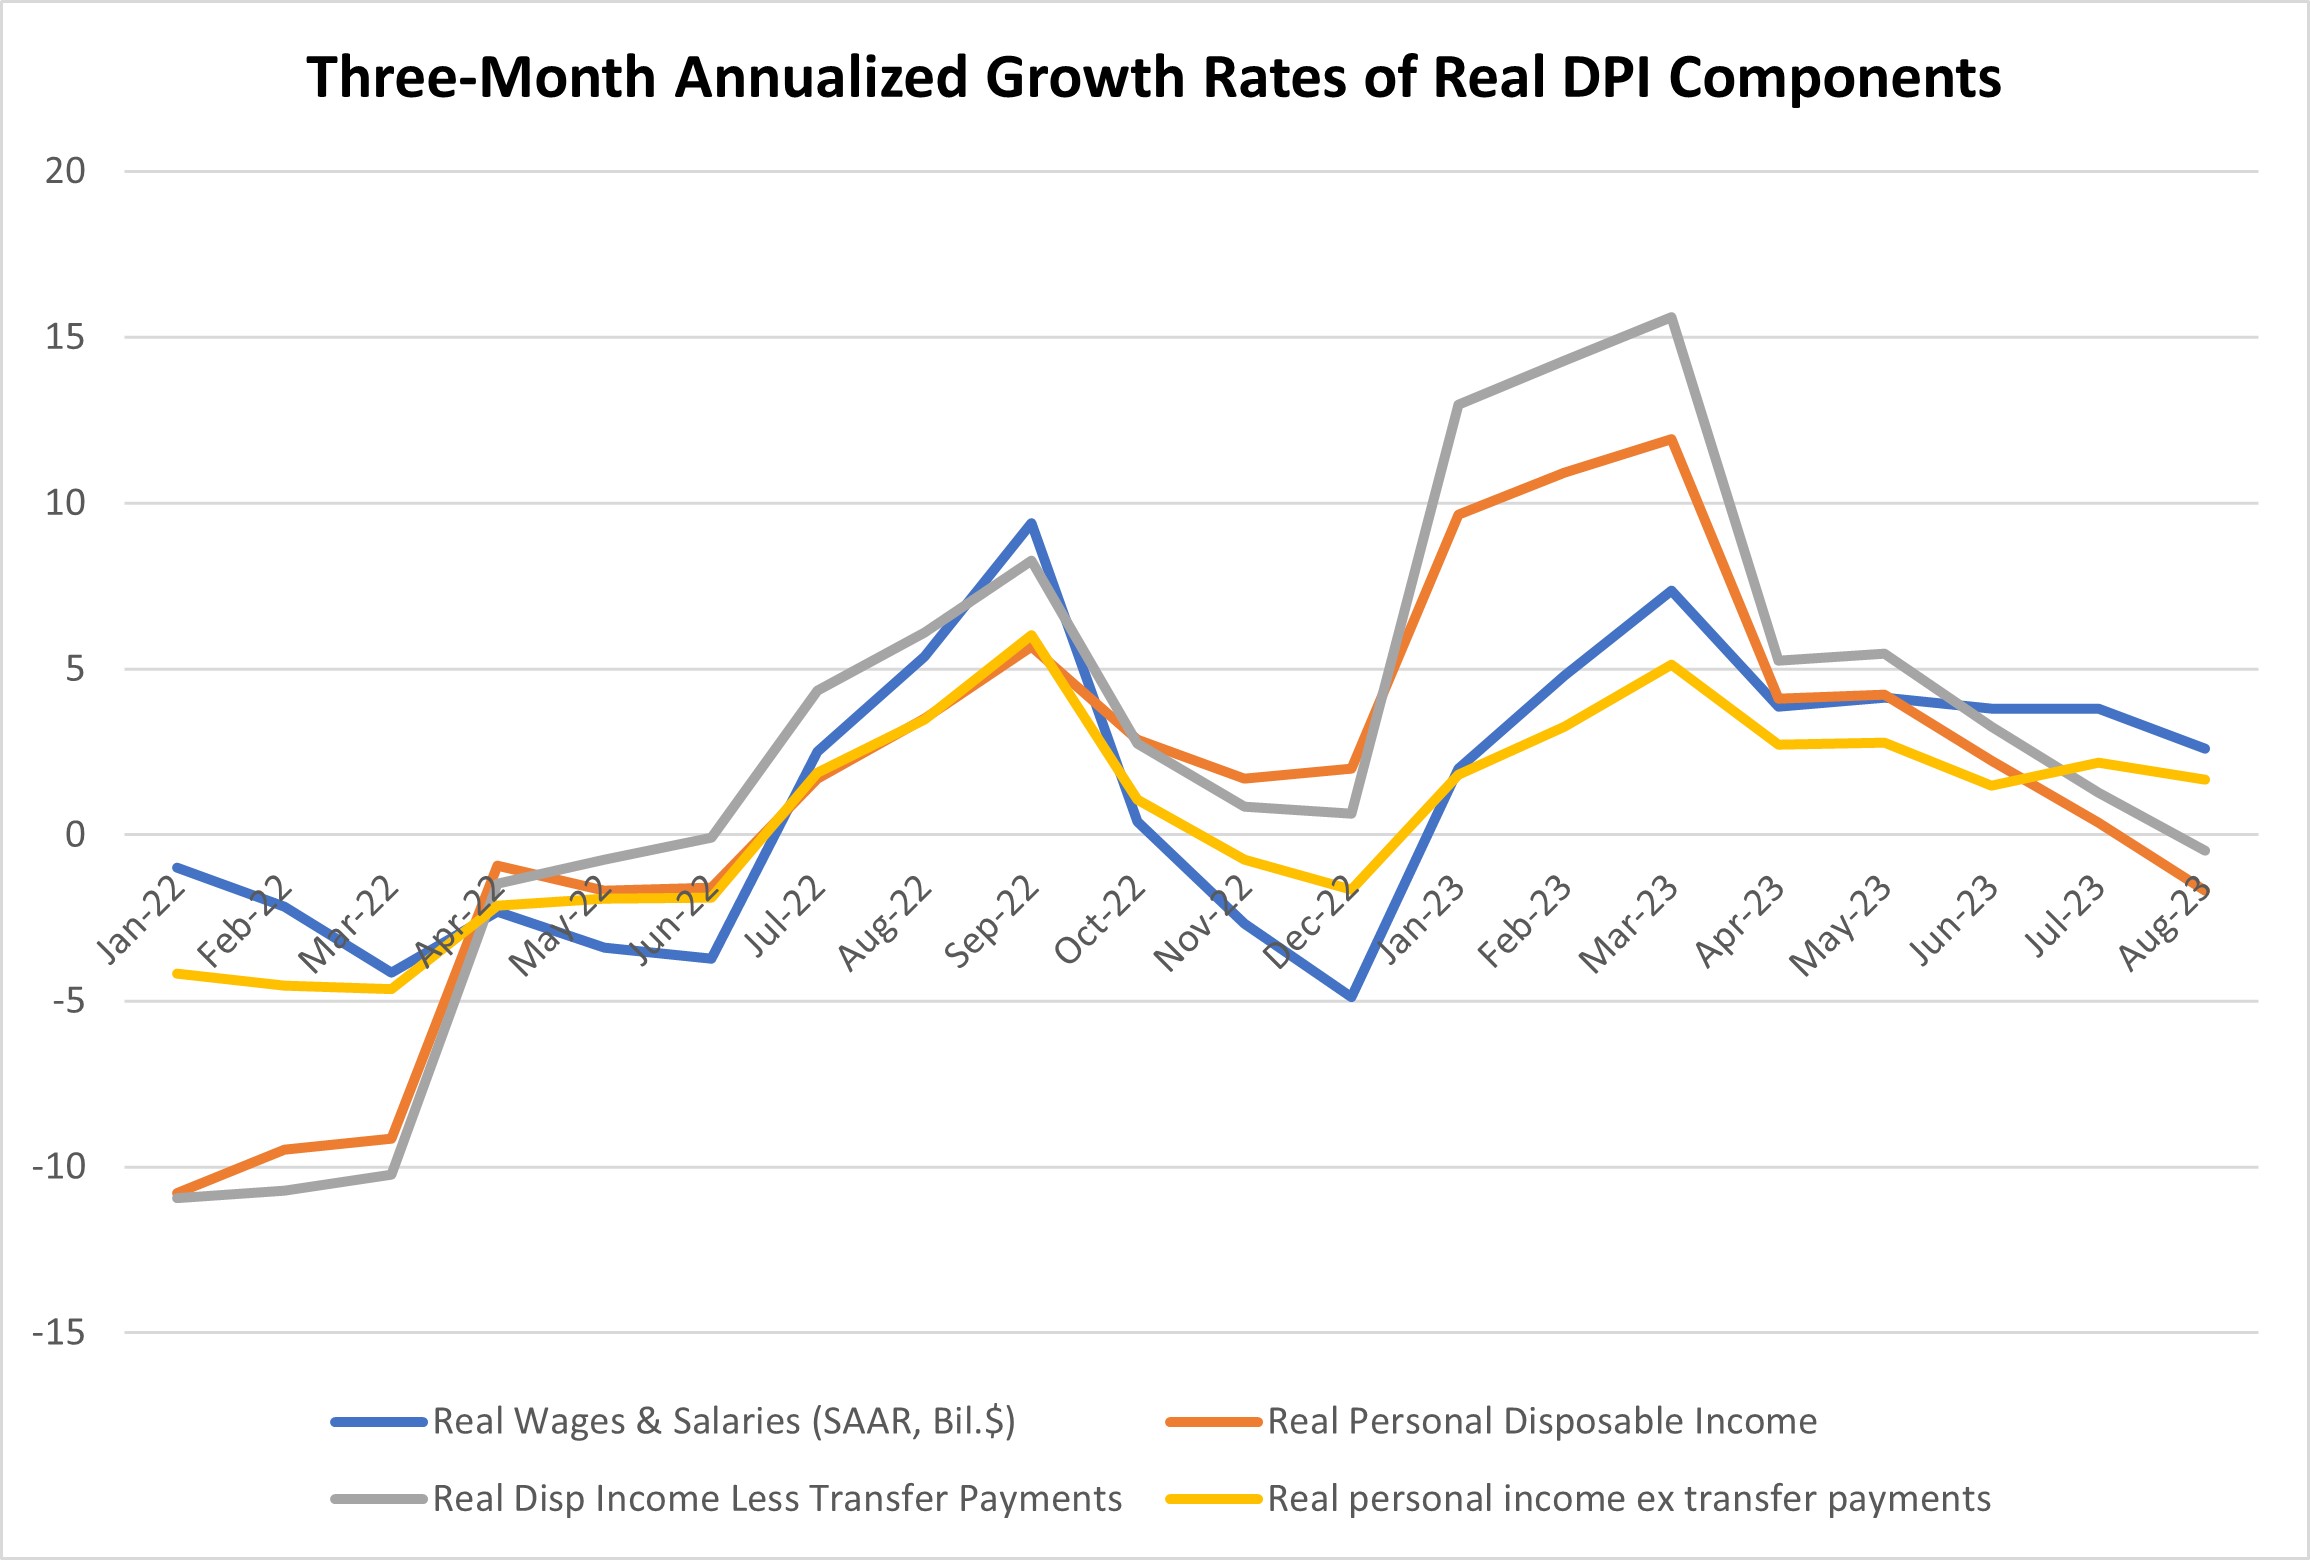
Figure 4 below shows three-month annualized growth rates of real DPI, real DPI less transfers, real personal income ex transfers, and real wage and salary income. We see that:
- Real wage and salary growth remains positive.
- Stripping out the effect of declining current transfer payments, real DPI less transfers is still slightly negative because households faced greater headwinds from higher taxes.
- Taking out both taxes and transfers, three-month growth of real personal income ex transfers remains in positive territory.
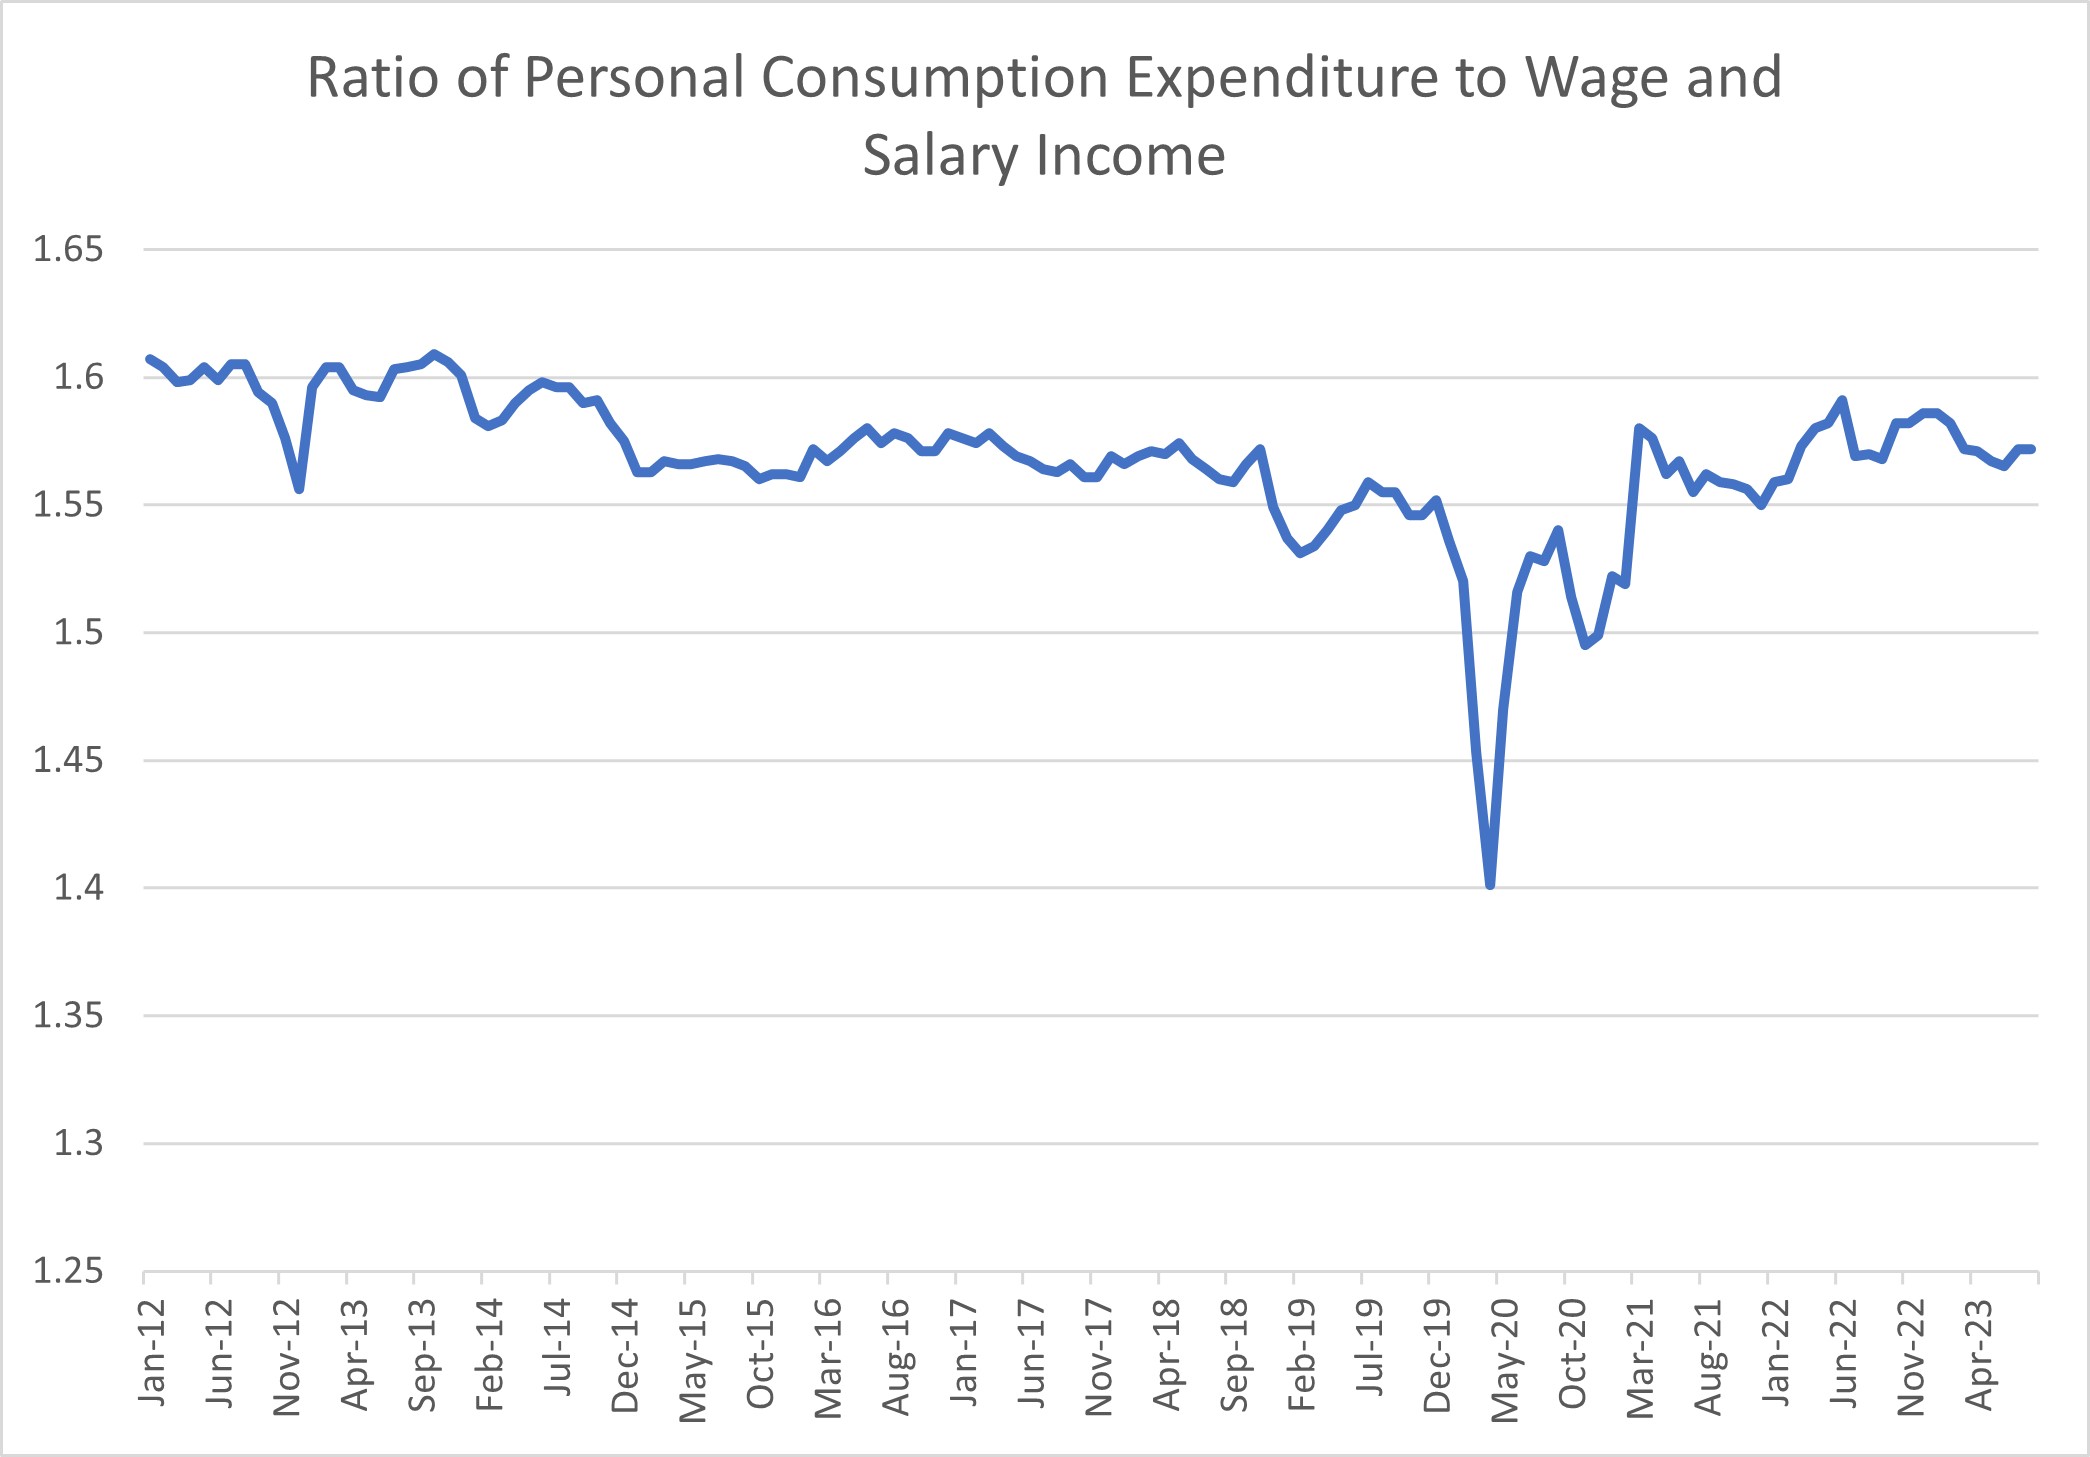
Steady growth in wage and salary income may bode well for spending. Figure 5 below shows the ratio of personal consumption expenditure to wage and salary income since 2012. Over the past decade, this ratio has been roughly stable, except for the pandemic recession when many businesses were shut down and pandemic health concerns were intense.
The ratio was quick to return to pre-pandemic levels once the immediate pandemic shock dissipated. The stability of this ratio suggests that wage and salary income may be the most important kind of income that households consider when making spending decisions.
With wage and salary income continuing to grow at a steady pace, consumer spending may be more resilient than recent monthly declines in real DPI might suggest.
Views expressed in this article are those of the author and not necessarily those of the Federal Reserve Bank of Richmond or the Federal Reserve System.


