Households Feeling Down in the Dumps
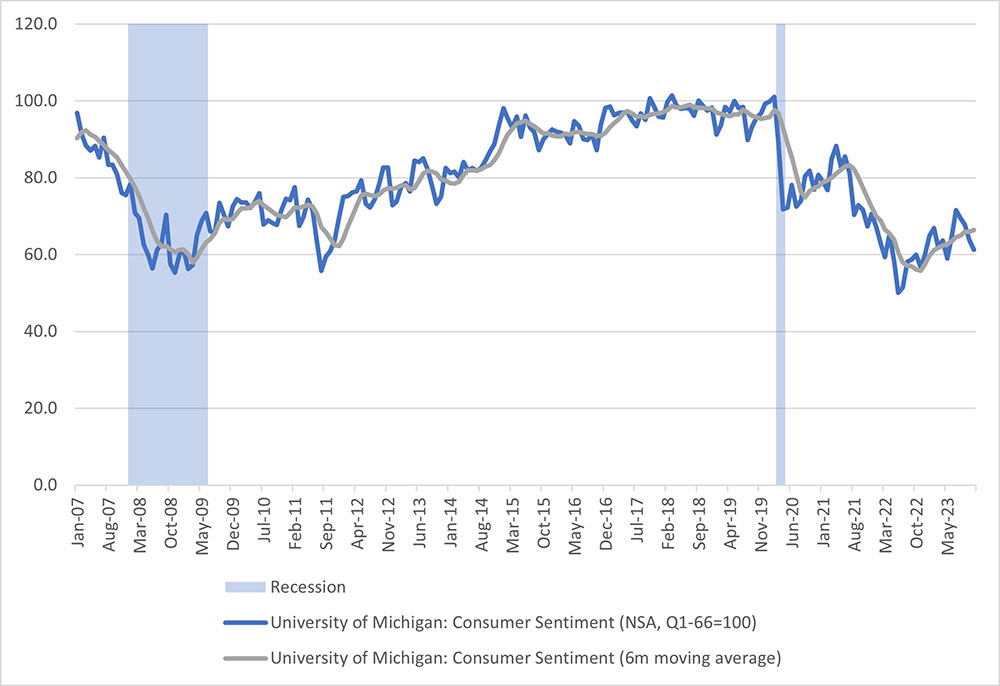
Why are households feeling so blue? According to the University of Michigan's Surveys of Consumers preliminary monthly estimate, consumer sentiment dipped to 61.3 in November versus 63.8 in October. This marked 25 straight months of sentiment scores being below the COVID-19 recession trough of 71.8 in April 2020. (See Figure 1 below.) Consumers' assessment of their current conditions deteriorated to 68.3 in November from 70.6 in October, while the consumer expectations score dropped to 56.8 from 59.3.
Low consumer sentiment is striking because the economy is performing well in some regards:
- The unemployment rate remains below 4 percent as of October 2023.
- GDP growth in the third quarter was 4.9 percent, compared to 2.1 percent in the second quarter.
- Gasoline prices — which historically have been a powerful influence on consumer sentiment — have fallen from $3.88 per gallon in the middle of September to $3.35 per gallon in the middle of November.
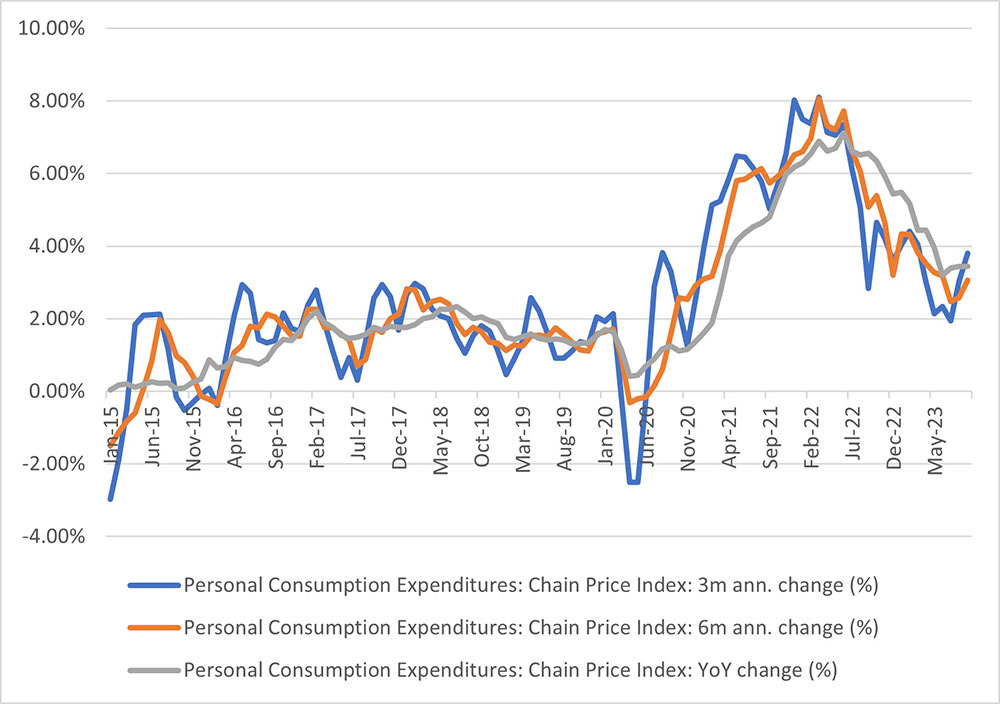
Furthermore, inflation is falling. Year-over-year PCE inflation — the Fed's preferred inflation measure — was 3.4 percent in September compared to 5.5 percent at the beginning of the year. Despite an uptick in three-month inflation in late summer (largely driven by gas prices), PCE inflation has generally been improving on a three-month and six-month annualized basis as well. (See Figure 2 below.)
In a recent speech at Duke University, Federal Reserve Governor Lisa Cook suggested that consumers may be upset that prices are not at pre-pandemic levels, even though inflation (the growth rate of the overall price level) is showing signs of improvement. She said that "most Americans (are) not just looking for disinflation... they're looking for deflation. They want these prices to be back where they were before the pandemic."
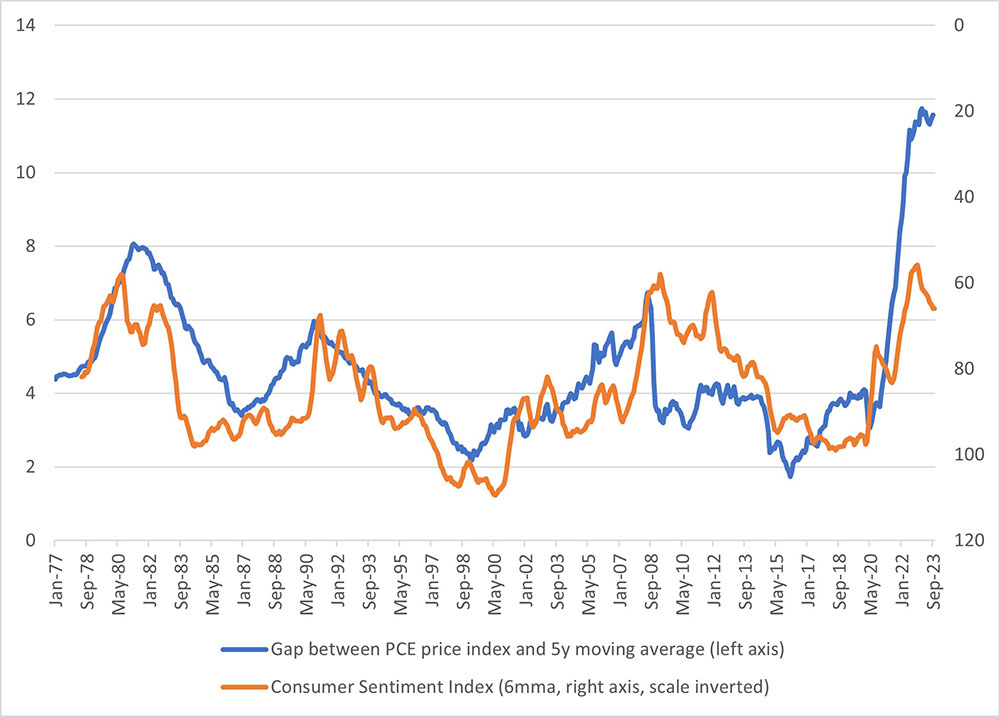
To see whether there's a relationship between elevated price levels and depressed consumer sentiment, we plot two series in Figure 3 below. The blue line (which corresponds to the left axis) plots the difference between the PCE price index and its five-year trailing moving average. Higher scores indicate periods where households face higher prices relative to five-year trends. The orange line (which corresponds to the inverted right axis) plots the Michigan consumer sentiment index, taking six-month averages to smooth though the monthly volatility.
The figure shows that higher price levels versus trend are correlated with lower consumer sentiment scores. This suggests, as conjectured by Governor Cook, that recent gloomy consumer sentiment scores may be more driven by persistently high price levels rather than above-target (though declining) inflation.
However, the figure also suggests we don't need to experience outright deflation to see consumer sentiment improve. Sentiment has improved over the course of 2023, despite the gap between the PCE price index and its five-year moving average remaining elevated. Furthermore, the price level gap versus trend will narrow as the rolling five-year window reflects more of the elevated price level readings observed after the pandemic.
For the next two weeks, we will be on hiatus due to the FOMC blackout. The Macro Minute blog will resume on Dec. 19 before taking an additional break due to the upcoming holiday season.
Views expressed in this article are those of the author and not necessarily those of the Federal Reserve Bank of Richmond or the Federal Reserve System.


