Are Workers Becoming More Anxious?
Macro Minute
May 7, 2024
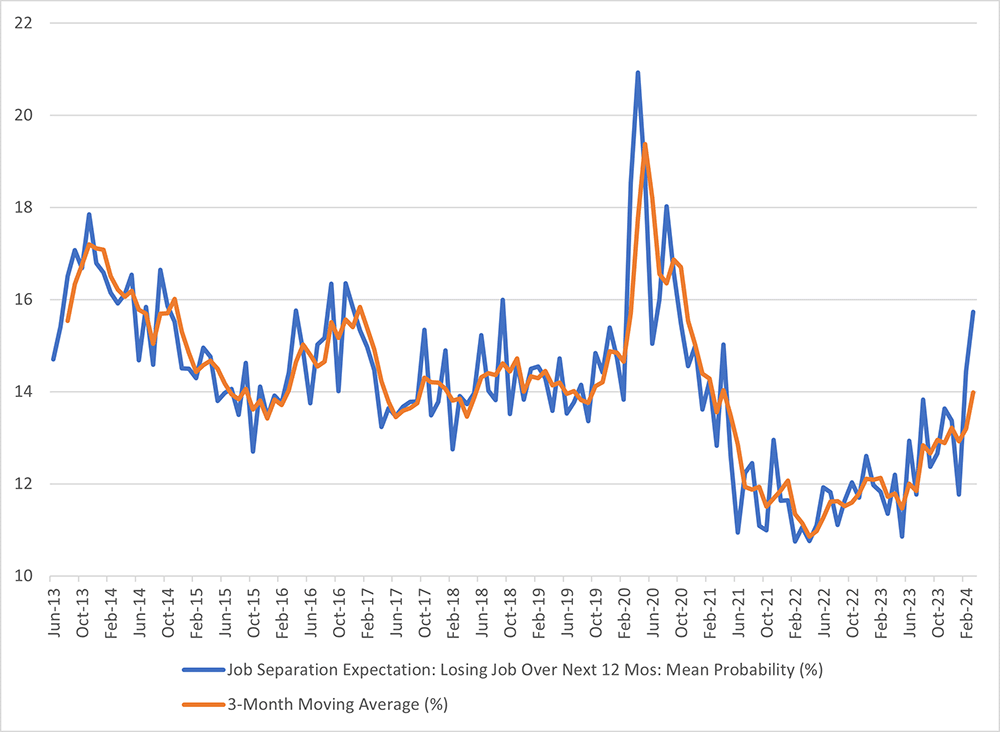
By most measures, the labor market is doing extremely well. In April, the economy continued to add 175,000 jobs to nonfarm payrolls, and the unemployment rate remained below 4 percent. In particular, in the New York Fed's Survey of Consumer Expectations (SCE), respondents who are not self-employed and who are either working full time, working part time, temporarily laid off or on sick leave are asked for the percent chance that they will lose their job in the next 12 months. In the most recent March survey, the average household saw a 15.7 percent probability of losing their job over the next 12 months, the highest since September 2020. (See Figure 1 below.)
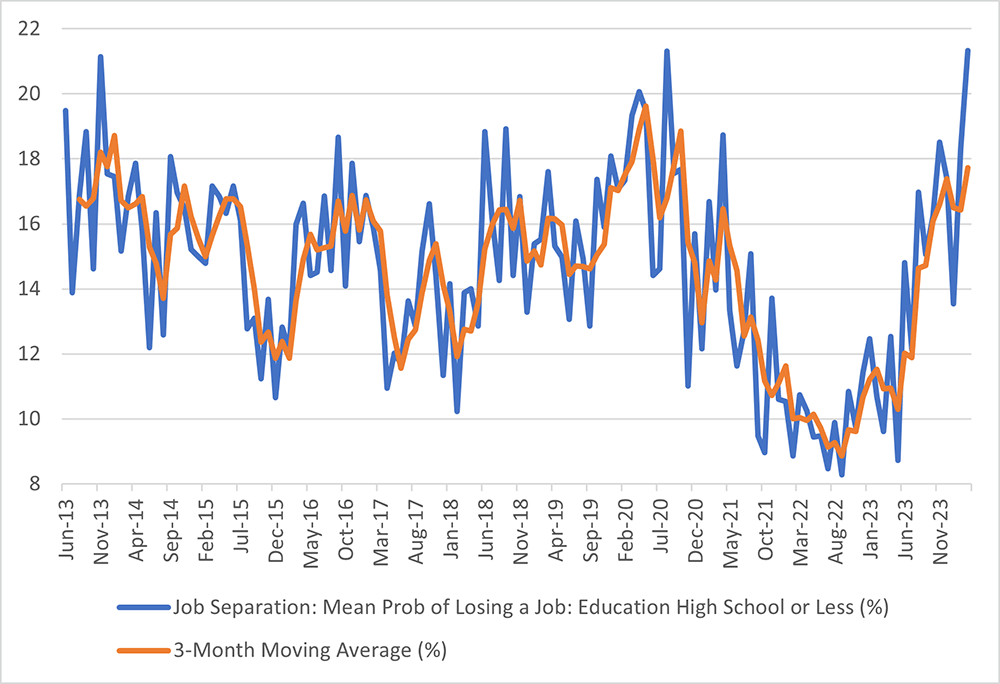
Job loss anxiety is even more pronounced for households with lower education levels, which might be expected considering less-educated households also face higher-than-average unemployment rates. For SCE respondents with a high school diploma or less, the expected probability of losing their jobs over the next year rose from 18.3 percent in February to 21.3 percent in March, the highest mark since the survey began in 2013. This is a sharp reversal from the confidence these consumers had a year and a half ago, when job loss anxiety hit a record low of 8.3 percent.
In a previous post, we discussed how surveyed sentiment can differ significantly from hard measures of economic performance. Is the recent spike in worker anxiety just another case of this phenomenon? Not necessarily, as higher job loss anxiety is affecting one aspect of worker behavior: job switching.
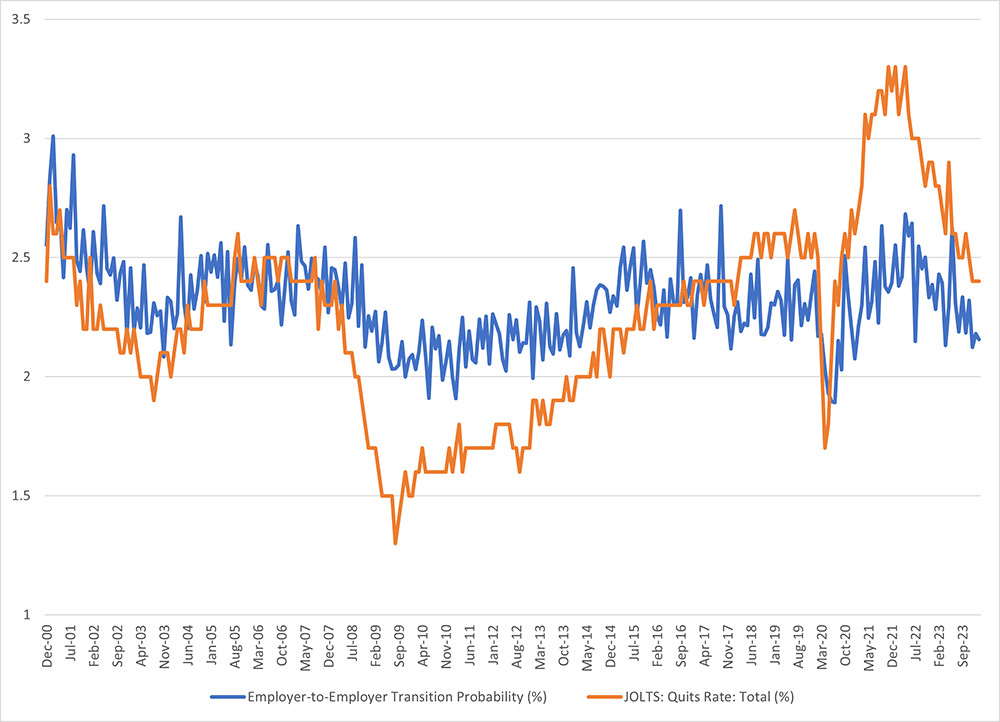
To measure job switching, we use the Fujita, Moscarini, and Postel-Vinay Employer-to-Employer Transition Probability (E2E-TP) published by the Philadelphia Fed. The E2E-TP measures the pace of worker reallocation in the job market and is represented by the number of job movers in the current month as a share of all employed workers in the previous month. The higher the percentage, the faster the rate that U.S. workers are transitioning from one employer to another. The index is computed from individual responses to the Bureau of Labor Statistics Current Population Survey and is available each month starting in October 1995.
Figure 3 below plots the E2E-TP series alongside another proxy for job switching: the quits rate published in the Job Openings and Labor Turnover Survey. (A key difference between the two measures is that not all quitters move on to new employers.) The correlation between the two series is 0.5 (or 50 percent), indicating a reasonably strong positive relationship.
In a world where workers are becoming more anxious about losing jobs, they might feel more hesitant to switch employers as well. In other words, as job loss anxiety increases, the E2E-TP might decrease. Do we observe such a relationship in the data?
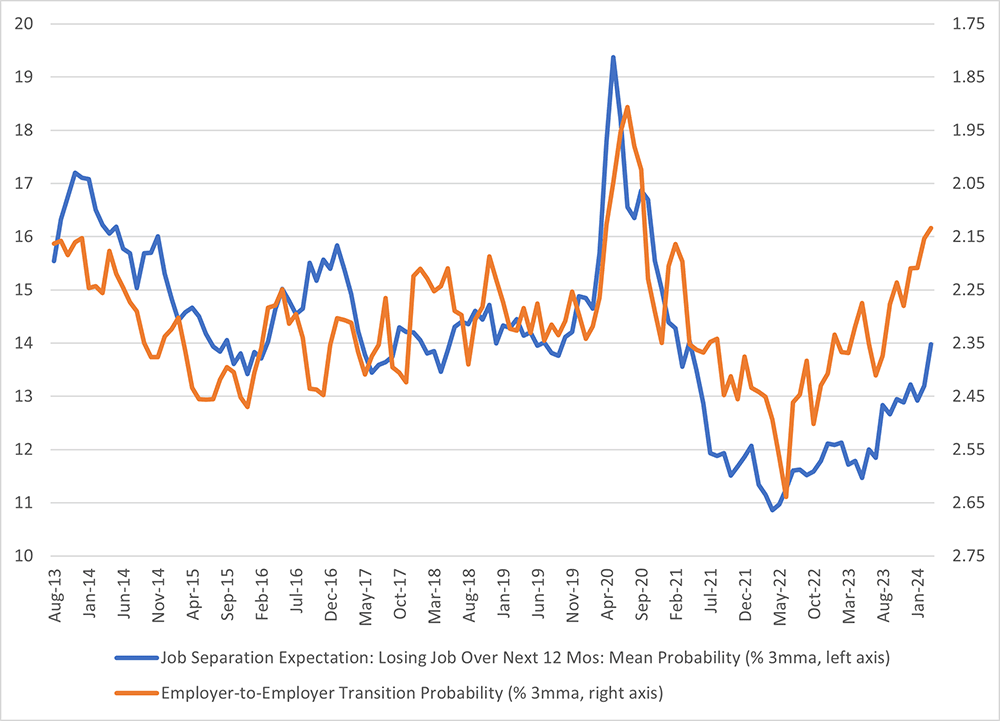
As shown in Figure 4 below, this is indeed the case. It plots the three-month moving average of expected job loss probabilities (the orange line from Figure 1) on the left axis against the three-month moving average of the E2E-TP measure on the right axis. The right axis is inverted so that the two series move together visually.
The correlation between the two series is -0.62, which suggests a strong negative relationship. For the original series (not taking three-month averages), the correlation is slightly lower at -0.40, but the relationship is still evident. In the sample, when the three-month moving average of job loss anxiety increases by 1 percentage point, the three-month moving average of E2E-TP tends to fall by 0.04 percentage points.
To conclude, it appears worker job loss anxiety is associated with actual changes in worker behavior, lowering the frequency of job switching in the economy. While not all survey sentiments carry through to observed data, in this case, we're seeing higher anxiety manifested in higher worker retention. This is another sign that the labor market has moved into better balance compared to the extremely tight conditions of two years ago.
Views expressed in this article are those of the author and not necessarily those of the Federal Reserve Bank of Richmond or the Federal Reserve System.
Contact Us