Home Prices: What Goes Up Must Come Down ... Right?
By the time the pandemic homebuying frenzy ended in mid-2022, U.S. home prices had risen more than 50 percent nationally in just three years. As mortgage rates spiked, home prices stabilized for several months — and even fell a little — but quickly started ticking up again. As of August, U.S. home prices have risen for 21 consecutive months, according to the Redfin Home Price Index (RHPI). In this week's post, we examine how low inventory is continuing to push home prices higher, even as rates remain elevated.
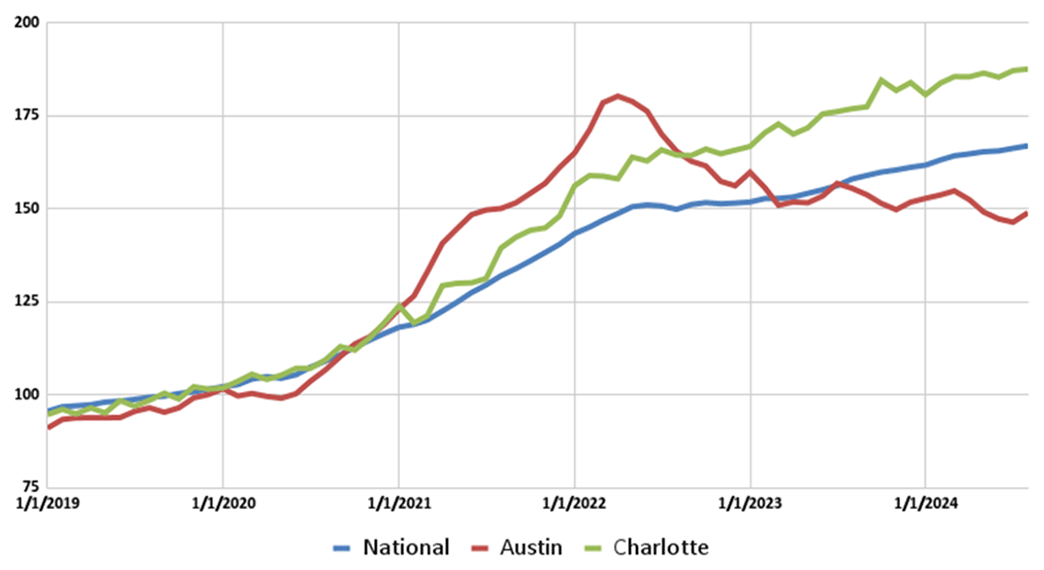
To start, it's worth pointing out that not everyone is living through the same experience: Some areas saw prices fall over the past two years, while others saw prices rise faster than the national rate. Figure 1 below shows that home prices in Austin, Texas — one of the more popular metros for relocating during the pandemic — have fallen 17.4 percent from their peak in April 2022, compared to a 12.2 percent increase nationally. In contrast, prices in Charlotte, N.C., outpaced national growth, climbing 18.7 percent over the same period.
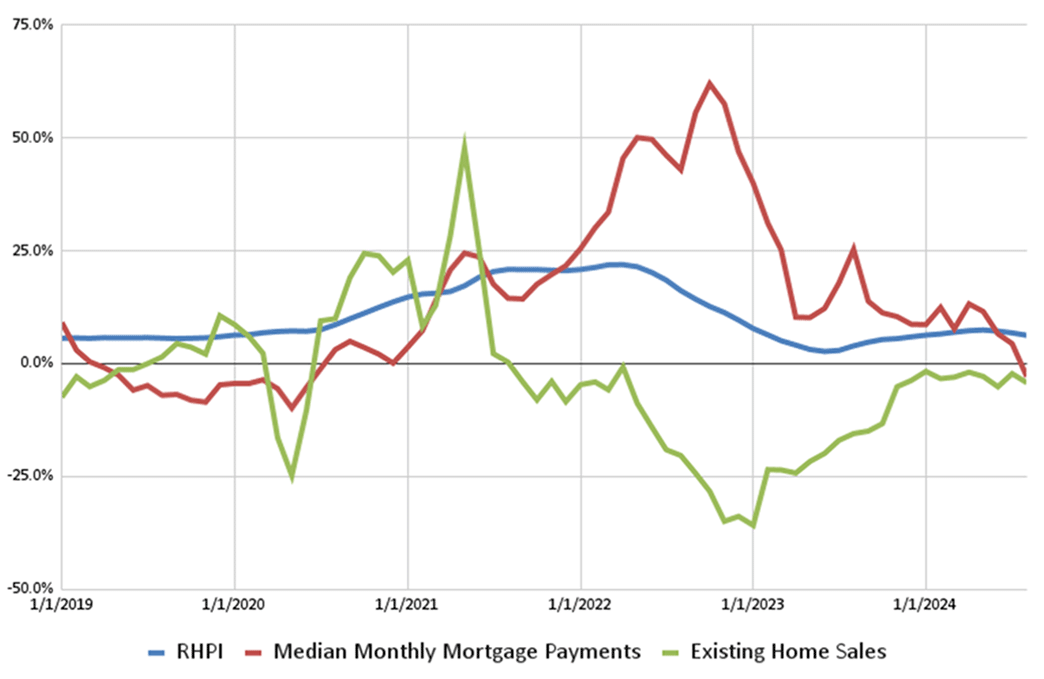
The sharp rise in interest rates in mid-late 2022 did, however, have a significant impact on home sales and put downward pressure on prices. Figure 2 below shows median monthly mortgage payments on newly issued mortgages spiking in late 2022, which led to 2023 experiencing the lowest number of existing home sales for a single year in nearly 30 years. Put simply, when buying a home became less affordable, fewer people bought homes.
Nationwide, annual home price growth slowed considerably over the same period but never dipped into negative territory. In mid-2023, price growth started to pick up pace again.
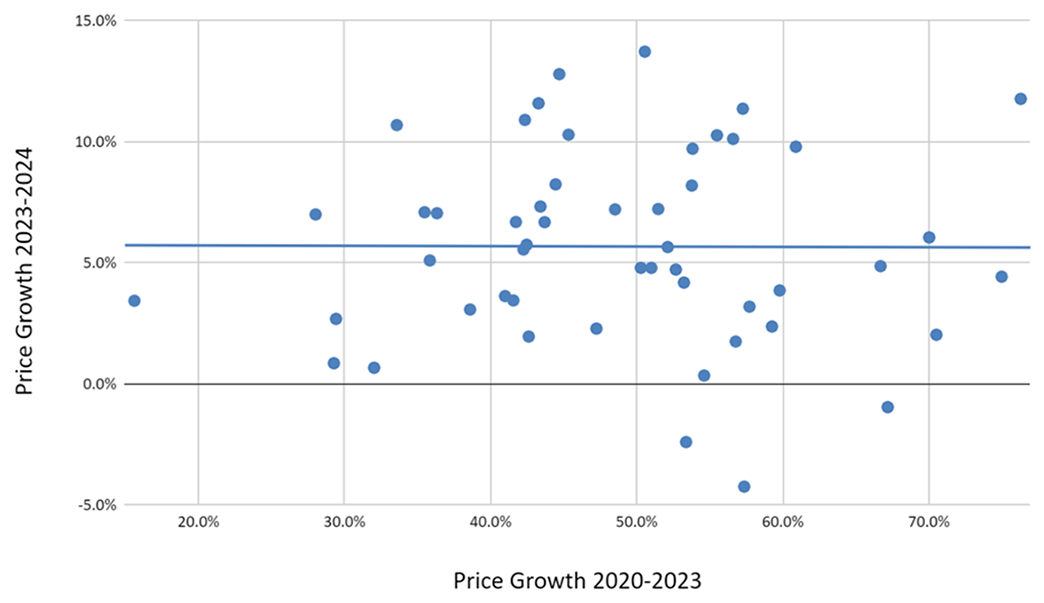
But why are home prices declining faster in some areas than others? Are recent declines in cities like Austin, Texas, simply a correction from an outsized price surge early in the pandemic? Figure 3 below compares price growth in the top 50 U.S. metros by population for the period January 2020-July 2023 (when the federal funds rate reached its peak) to growth for the period August 2023-August 2024 (when the fed funds rate was maintained at its recent peak between 5.25 and 5.5 percent).
What the chart shows, however, is that there is no correlation between the two periods. Several metros — such as Miami and Cincinnati — saw price growth in excess of 50 percent from 2020-2023, then continued to grow by more than 10 percent over the past 12 months. Others — such as Austin, Texas, and Jacksonville, Fla. — experienced the same initial 50 percent-plus spike, but have experienced a decline in prices over the past 12 months.
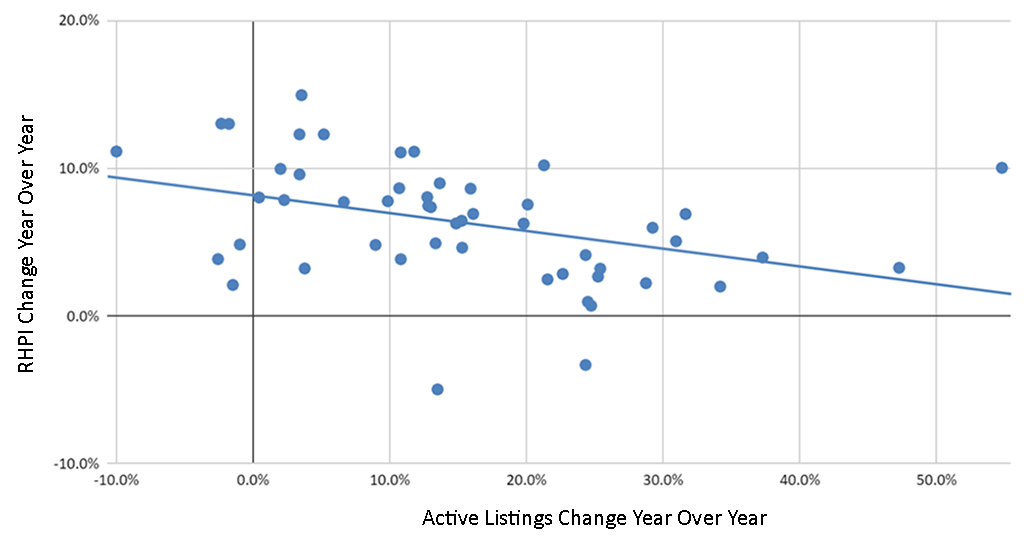
Instead, to answer why prices kept rising, we must examine supply conditions. Figure 4 below shows that, between August 2023-August 2024, metros that saw bigger increases in the number of homes on the market also saw slower price growth during that period. Some (such as Austin, Texas) even experienced outright declines.
These results suggest there isn't enough inventory to push home prices down — a sign of inadequate levels of new home construction. There may also be some contribution from the mortgage lock-in effect discussed in a previous post: More than 50 percent of mortgaged homeowners have a rate below 4 percent, discouraging them from selling their homes, moving somewhere else, and facing a rate above 6 percent. The result? There were 25 percent fewer existing homes on the market in August compared to pre-pandemic levels in August 2019.
In short, when it comes to home prices, without supply conditions responding, what goes up could stay up.
Note: Sheharyar Bokhari is a senior economist at Redfin, and John O'Trakoun is a senior policy economist at the Federal Reserve Bank of Richmond. The views and opinions expressed in this post are those of the authors and do not necessarily represent the official position of Redfin or the Federal Reserve Bank of Richmond.


