Multifamily Housing Supply and Rents: Feast Today, Famine Tomorrow?
Macro Minute
May 21, 2024
In a recent post, I discussed how multifamily housing starts have weakened as previously started projects are being completed, leading to a surge in multifamily housing completions. This additional supply could be contributing to a softening in rents, particularly for new listings where rent growth has fallen much more than the official rent measures, which include both new and existing tenants.
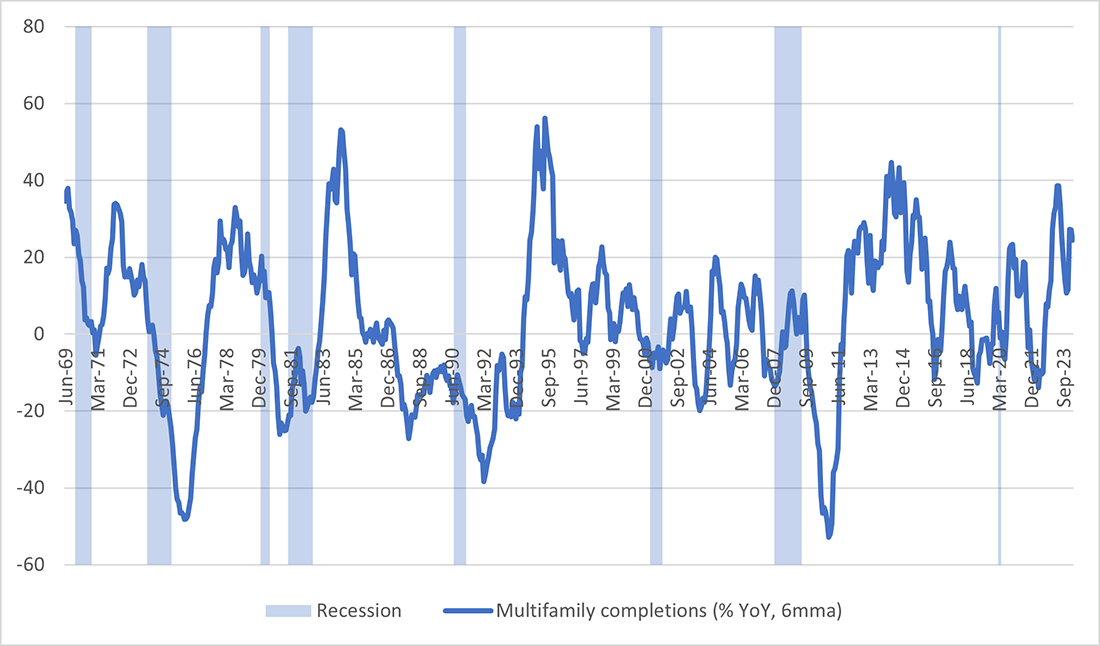
Looking beyond the near term, what might we expect in terms of multifamily housing supply? Figure 1 below shows monthly data on year-over-year growth rates of multifamily housing completions from 1968 through the present. The figure suggests that multifamily completions appear to swing between high-growth and low-growth periods. This appears to occur even outside of recessions, which are shaded in blue in Figure 1.
These cycles are also evident when looking at the autocorrelation of multifamily housing completions. Autocorrelations reveal the strength of the relationship between a series and its own past or future values at various horizons.
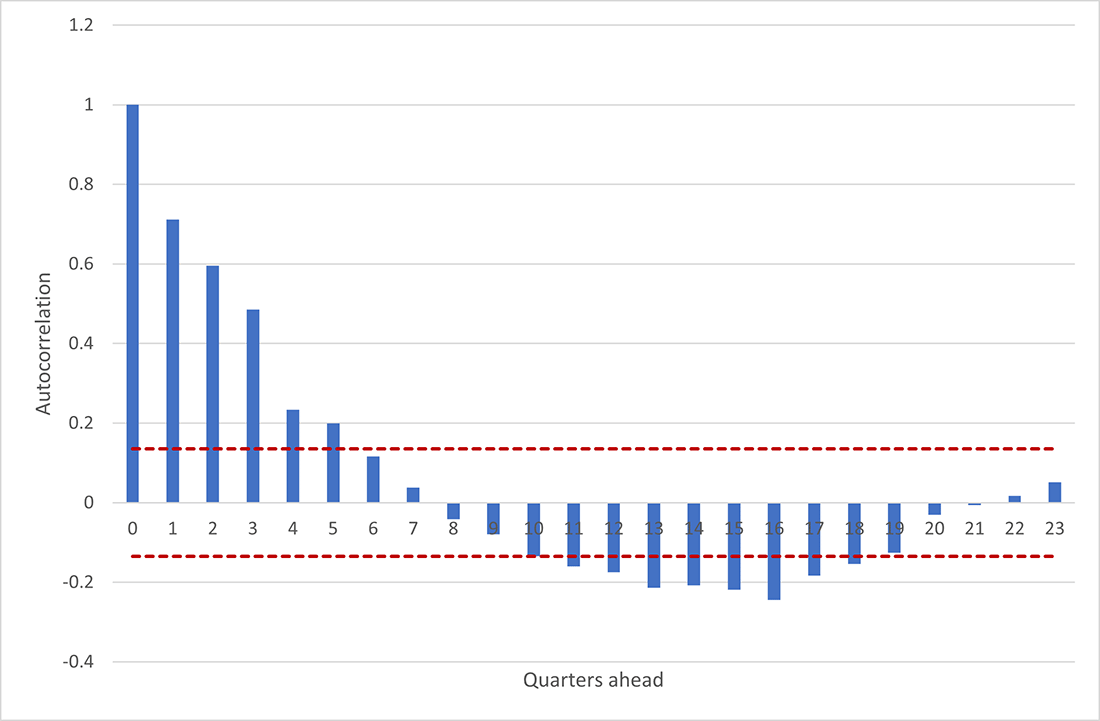
In Figure 2 below, I plot the autocorrelation of year-over-year growth in multifamily housing completions, this time looking at quarterly data. The red dashed lines in Figure 2 are 95 percent confidence bands: Correlations that exceed these limits are considered statistically significant.
The positive values from 1 through 5 indicate that current growth rates are positively correlated with future growth rates out to five quarters. However, growth rates that are 11 to 18 quarters ahead tend to be negatively correlated with current growth rates. That could indicate that today's strong growth in multifamily housing completions might be expected to continue in the very near term, but this could be followed by a period of weaker growth two to four years ahead if historical patterns hold.
If today's elevated level of multifamily housing completions is putting downward pressure on rents, what might a future period of low multifamily supply do to rents? To explore this question, I estimate a vector autoregression model that explores the relationship between three variables:
- Year-over-year rent growth rates as measured by the rent CPI (the outcome variable of interest)
- Year-over-year growth in multifamily housing completions (the explanatory variable of interest)
- The multifamily rental vacancy rate from the Census Bureau (a measure intended to capture supply-demand conditions in the rental market)
The model explains each variable using its own lags as well as the lags of the other variables and can be used to construct forecasts for rents and multifamily completions. I use statistical procedures to determine how many lags — in other words, how long of a "look-back" window — the model should use. The statistical tests suggest five lags should be included, which means the model looks back at the previous year plus one quarter's worth of data.
Interestingly, the model suggests that — after controlling for lagged rent growth and vacancy rates — multifamily completions do not have a statistically significant impact on current rent growth. However, completions do appear to have a statistically significant impact on vacancy rates and can influence rent growth through that channel.
Figure 3 below plots the model's forecast for year-over-year growth in multifamily completions. Growth is expected to slow from 28.6 percent in the third quarter of 2024 to 17.0 percent the following quarter, dropping into negative year-over-year territory in the first quarter of next year and hitting a trough of negative 14.9 percent in the third quarter of 2025. The shaded gray area in Figure 3 indicates the 68 percent confidence interval around this projection, with the wide band indicating a high degree of uncertainty surrounding the forecast.

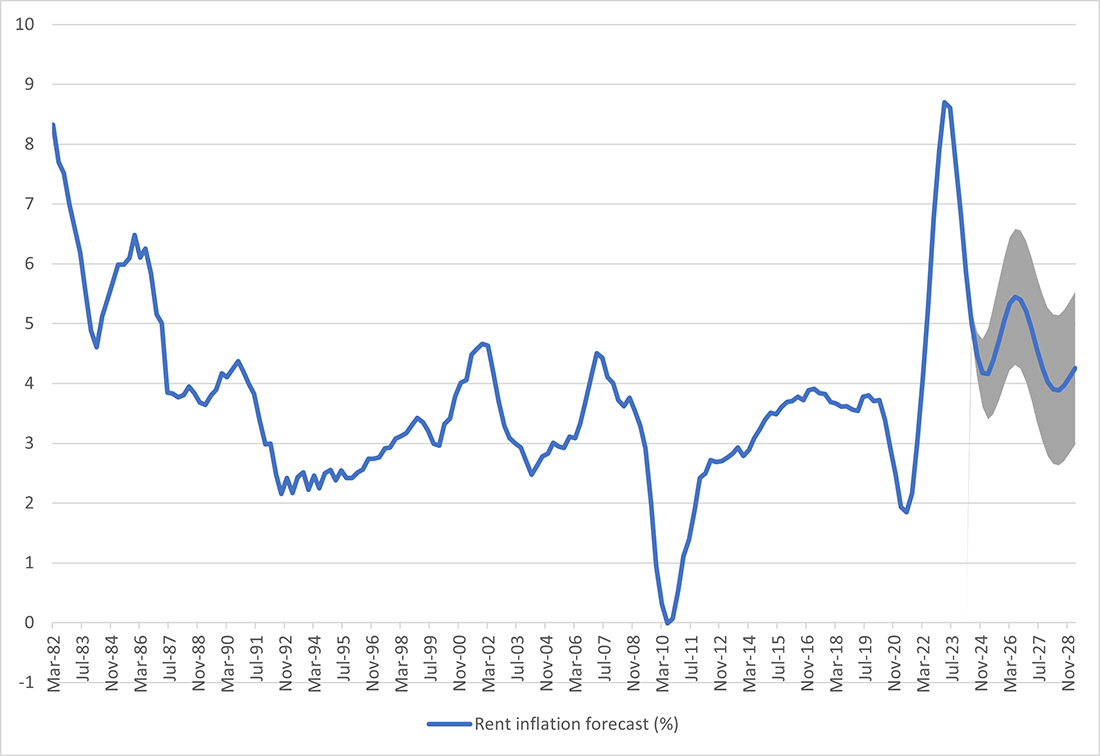
The model's forecast for rent growth is shown in Figure 4. The rent growth rate is projected to slow from 5.8 percent in the first quarter of 2024 to 4.2 percent by the end of the year. However, the model sees it picking up in the middle of 2024 and increasing to a peak of 5.4 percent in the third quarter of 2026. As in Figure 3, Figure 4 shows the 68 percent confidence interval around the forecast. Notably, the lower band of the confidence interval is above the most recent pre-pandemic level of rent growth during the quarters that it is expected to peak.
These statistical forecasts should always be taken with a grain of salt: They're based on historical correlations which may not reflect the state of the economy in the future. However, if these historical patterns play out once more, today's feast in terms of multifamily housing supply could be followed by tomorrow's famine, putting upward pressure on rent growth once again.
Views expressed in this article are those of the author and not necessarily those of the Federal Reserve Bank of Richmond or the Federal Reserve System.
Contact Us