
Measuring Social Capital Across the Fifth District
How cliquey is your community? How often do people from different income groups in your area befriend one another? Do your neighbors volunteer their time to charitable causes? Social scientists have long studied social capital — the strength and value of social networks within communities — as well as its effects on economic, health, and political outcomes. Political scientists have linked higher civic engagement with the strength of democratic institutions, while economists have studied the role that friendships across socioeconomic statuses might have in fostering economic mobility.
Social capital can be measured along several different dimensions and compared across geographies. Identifying measures of social capital can be challenging for researchers since it is not directly observed and is largely conceptual in nature. Researchers have traditionally measured social capital with proxy variables (such as membership in volunteering organizations) or survey results (such as measures of trust, obligation, or solidarity within a community) to compare its intensity across time and place. This resulted in time-consuming fieldwork for researchers and inconsistent measures of social capital across studies due to choice of time, geography, and measurement method.
Recently, however, researchers at Opportunity Insights — a research group based at Harvard — have compiled a dataset using data from over 70 million Facebook users in an attempt to quantitatively measure social capital across the United States for a given time period. This dataset, the Social Capital Atlas, offers a consistent, comprehensive resource to assess U.S. counties and ZIP codes along various degrees of social capital, which may provide value in guiding policymaking and studying various social outcomes. This article explores the Social Capital Atlas dataset at the county level to assess how three measures of social capital vary across the Fifth District: economic connectedness, cohesiveness, and civic engagement.
What is Social Capital?
Social capital is the value derived from networks of relationships among people who live and work in a society. Harvard political scientist Robert Putnam suggests that some forms of social capital are formal, such as a parent-teacher association, labor union, or other civic organization with established membership and executive responsibilities. Other forms are less formal, such as neighbors keeping watch over one another's homes or other reciprocity norms (picking up litter, friends vouching for one another). Both types of social capital facilitate information flows and normalized behaviors that provide mutual aid for society members.
Economist Matthew O. Jackson of Stanford University and the Sante Fe Institute further distinguishes among several different functional types of social capital held by individuals within an overarching social network. For example, Jackson refers to leadership capital as being connected to people who may not typically interact with each other (such as people of different socioeconomic statuses), which aids the ability to coordinate behavior. Reputation capital is the collective community belief that "a person or organization is reliable and/or provides consistently high-quality advice, information, labor, goods, or services." The former should facilitate the latter as the spread of information among disparate community members reinforces the reputation of individuals and organizations within a community.
Why Does Social Capital Matter to Economists?
Individuals seem to place high value on social capital as a community resource. Social capital is a desirable community characteristic in and of itself, as individuals tend to benefit from high levels of social interaction through better mental health, subjective well-being, and some physical health outcomes. While it is not easily evaluated in monetary terms, research suggests that individuals regard social capital like any other amenity that improves the desirability of a community, such as low crime, good weather, or proximity to a world-class art museum. The amenities are capitalized into local housing prices and rents such that their perceived values are reflected through individuals' willingness to pay for them. Studying relationships among neighbors within an area might provide a window into how social capital influences migration decisions.
A 2018 Pew Research Center Survey finds that friendships with neighbors influence community attachment, while both factors are linked to one's desire to relocate. "Adults who say they know all or most of their neighbors are more than twice as likely as those who don't know any of their neighbors to say they feel very or somewhat attached to their community (77% vs. 32%)." Moreover, "people who say they are not too or not at all attached to their community are about five times as likely as those who feel very attached to say they would like to move to a new community (50% and 11%, respectively)."
Social capital is a desirable community characteristic in and of itself, as individuals tend to benefit from high levels of social interaction through better mental health, subjective well-being, and some physical health outcomes. While it is not easily evaluated in monetary terms, research suggests that individuals regard social capital like any other amenity that improves the desirability of a community.
Moreover, the benefits of social capital extend beyond its value as a conventional amenity, as it has been found to be a positive predictor of several life outcomes such as socioeconomic success in early adulthood, educational attainment, and financial behavior.
Lastly, of particular interest to economists, social capital may facilitate the American Dream. Research suggests that social connections make a difference in labor market outcomes and might influence the career trajectories and economic paths of individuals through mentorship, job referrals, or information sharing.
The Social Capital Atlas
Data limitations make quantifying social capital and understanding its impact on economic and social outcomes challenging. In a novel approach, Raj Chetty of Harvard University and the team at Opportunity Insights partnered with researchers to leverage privacy-protected data from the social network website Facebook.
The researchers studied the social networks of 72.2 million U.S. Facebook users between the ages of 25 and 44, an age bracket within which more than 80 percent of adults have used Facebook. They restrict the sample to users active at least once in the last 30 days with at least 100 U.S.-based Facebook friends and who have a non-missing ZIP code. Arguing that Facebook friendships often derive from in-person connections and that Facebook requires both individuals to confirm the relationship to form the connection, the researchers suggest these virtual connections are reasonable proxies for an individual's real-life social networks.
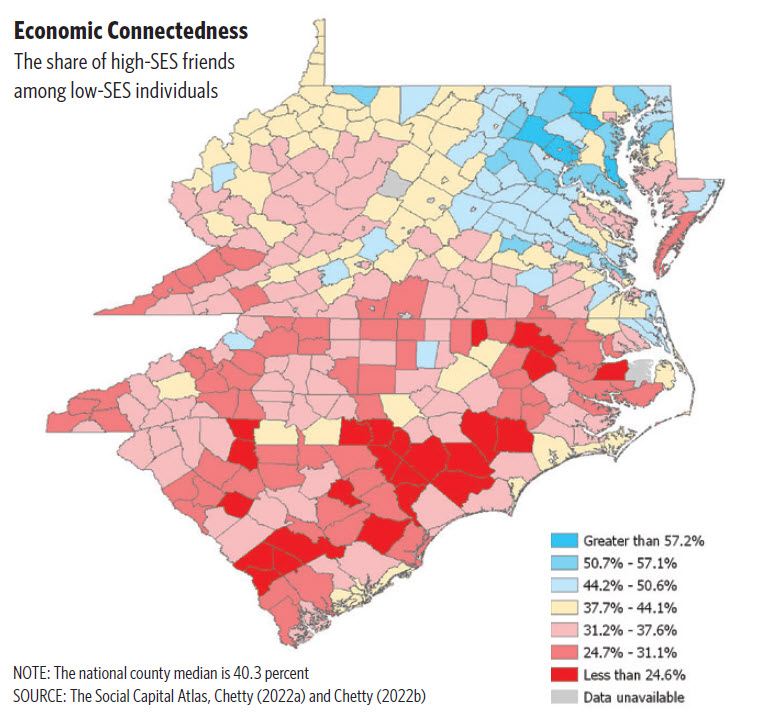
The authors used the social networks formed by 21 billion friendship pairs from the Facebook sample to construct variables representing three key dimensions of social capital. First, economic connectedness represents the degree to which people of different socioeconomic status (SES) are friends with one another. This cross-type connectedness is a form of “bridging” capital. Research has shown that connections with highly educated or affluent individuals can facilitate the transfer of knowledge and resources and can ultimately affect economic and employment outcomes. In the Facebook user sample, Chetty and his co-authors identify the characteristics of individual Facebook users (such as location, education, and age) and combine them with the average income in that user's area to produce a SES index. Then, they use this index to rank users nationally in relation to other users in their birth cohort. This allows the researchers to divide the population in each county into above-median (high-SES) and below-median (low-SES) groups.
The economic connectedness variable measures the relative share of low-SES individuals' friends that have a high SES. In other words, economic connectedness is the share of a low-SES person's friends who have a high SES divided by 0.5 — the share of high-SES friends if friendships were not dependent on income.
A value of zero indicates that none of a low-SES person's friends have a high SES on average, indicating very low economic connectedness. A value of one indicates that 50 percent of friends in a low-SES individual's network are high income. Values that exceed one indicate that, on average, low-SES individuals have more high-SES friends than low-SES friends. For example, in the city of Richmond, the economic connectedness value is 0.72, indicating that Richmond has low economic connectedness — only 36 percent of low-SES individuals' friends are high income, and high-SES friends are underrepresented by 28 percent. Communities with low economic connectedness are areas where low-SES persons largely befriend one another, while high economic connectedness suggests that SES plays little role in determining friendships.
Chetty and his co-authors find that economic connectedness is a strong predictor of upward mobility even after controlling for poverty rates, income inequality, and racial segregation. ... [They also] find evidence that economic connectedness may improve intergenerational economic mobility.
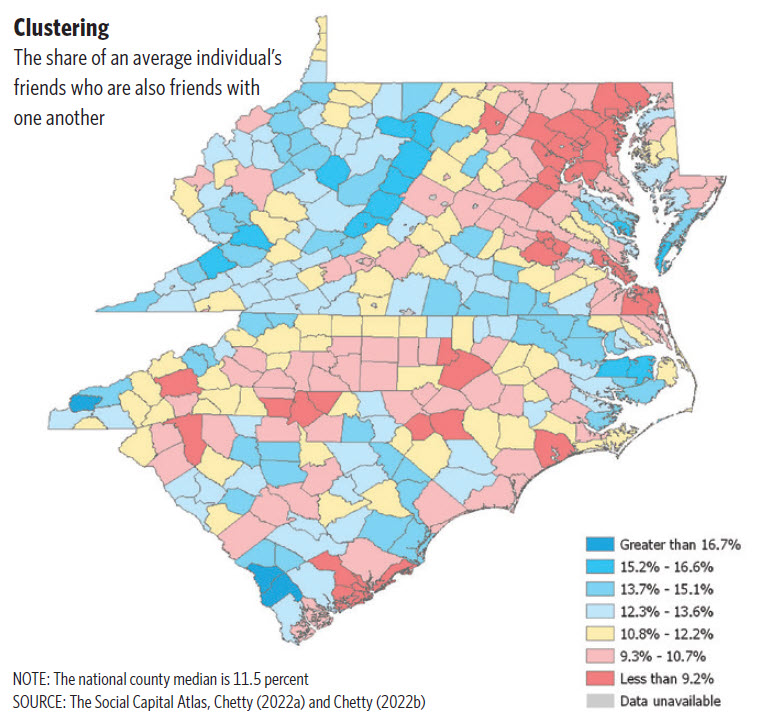
Second, cohesiveness represents the structure of a community's social networks — or the degree to which friendships are fragmented into cliques and whether friendships are supported by mutual friends. Research suggests that cohesiveness can affect key outcomes like human capital accumulation and adherence to social norms. The researchers construct three measures of cohesiveness using individual social networks: clustering, support ratio, and spectral homophily.
The clustering measure represents the extent to which an individual's friends are friends with one another. The authors construct this variable using the locations of individual Facebook users and their friendship links across others within a community. They argue that higher rates of clustering may help reinforce social norms and pro-social behavior as friends can act together to sanction or pressure a mutual friend. Clustering values range from zero to one, with a score of 0.5 indicating that, on average, half of an individual's friends are friends with one another.
Our Related Research
"Community Foundations: Problem Solving at the Local Level," Speaking of the Economy, Sept. 22, 2021
"Commuting Patterns and Economic Connectivity in the Fifth District," Economic Brief No. 22-47, November 2022
"Land of Opportunity? Economic Mobility in the United States," Economic Brief No. 13-07, July 2013
The support ratio, ranging from zero to one, measures the share of friendships in a network that are "supported." A friendship is supported if two friends have at least one other friend in common. Finally, spectral homophily, which also ranges from zero to one, measures how fragmented or cliquey a community is. A value of zero indicates that a member of the community is equally likely to be friends with any other community member, while a value of one indicates that the network is fragmented into insular groups.
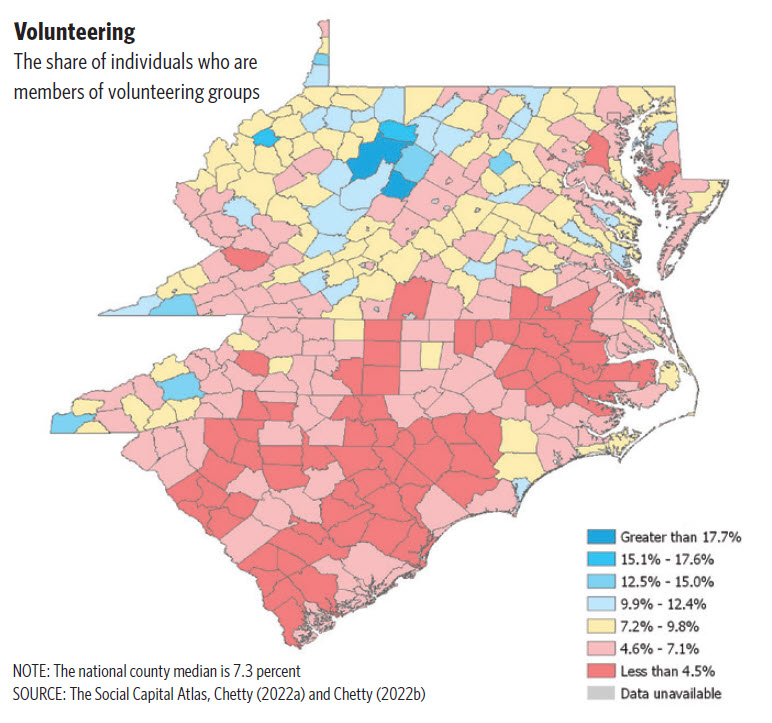
Finally, civic engagement measures the rate at which individuals volunteer or participate in local organizations. This type of social capital does not rely on social networks and is linked in research to outcomes including economic growth and political accountability.
For each county, Chetty and his co-authors calculate a volunteering rate representing the share of individuals in that county who belong to at least one volunteering or activism group. The group volunteering variable is constructed using the locations of individual Facebook users and whether they are members of at least one volunteering group. A second measure of civic engagement is the density of civic organizations. A county's civic engagement score is the number of civic or "public good" organizations based in that county (indicated by relevant Facebook group pages) per 1,000 residents.
The size and richness of the dataset Chetty and his co-authors construct includes average values of economic connectedness, cohesion, and civic engagement estimates for counties, ZIP codes, high schools, and colleges across the United States. They have made these data publicly available via download and through a data visualization tool.
Social Capital in the Fifth District
Economic connectedness varies significantly across U.S. counties. Nationwide, the share of high-SES friends among low-SES individuals ranges from 17.8 percent to 64.6 percent. In the Fifth District, the counties with the highest economic connectedness relative to the national median of 40.3 for low-SES individuals are in Maryland and northern Virginia. (See map below.) South Carolina and North Carolina have comparatively low levels of economic connectedness among low-SES individuals.
Chetty and his co-authors differentiate between two determinants of economic connectedness. Exposure represents the frequency with which low-SES people interact with high-SES people and is measured by the share of individuals with above-median SES multiplied by two. Friending bias, the tendency of low-SES people to become friends with high-SES people with whom they interact, is measured as one minus the share of friends they make with high-SES individuals divided by the share of people in the group who have a high SES.
In other words, if friendships in a group are formed at random, friending bias would be zero. Any friending bias greater than zero indicates a lower probability of making friends with high-SES individuals even after controlling for exposure.
Patterns in these determinants explain the variation in the Fifth District when comparing counties with the highest and lowest degrees of economic connectedness. (See table below.) Low-SES individuals in counties with high economic connectedness have both higher rates of exposure to high-SES individuals and, conditional on exposure, less bias toward becoming friends with high-SES individuals. In Arlington County, Va., for example, an average low-SES individual has more high-SES friends than low-SES ones. By contrast, only 22 percent of the friends of an average low-SES individual in Vance County, N.C., have a high SES. Low-SES individuals have fewer opportunities for contact with high-SES individuals in Vance (23 percent compared to 71 percent in Arlington) and also are less likely to become friends with the high-SES individuals they do meet.
| Economic Connectedness in the Fifth District | |||
| Economic Connectedness | Determinants of Economic Connectedness | ||
| Highest EC Counties | Exposure | Friending Bias | |
| Arlington County, VA | 64% | 71% | -1% |
| Loudoun County, VA | 61% | 71% | 3% |
| Carroll County, MD | 60% | 69% | 5% |
| Calvert County, MD | 60% | 64% | 2% |
| Fairfax County, VA | 59% | 69% | 1% |
| Alexandria city, VA | 58% | 66% | -3% |
| Howard County, MD | 57% | 67% | 0% |
| Rappahannock County, VA | 56% | 57% | -3% |
| Harford County, MD | 55% | 61% | 3% |
| Stafford County, VA | 55% | 63% | 3% |
| Lowest EC Counties | Exposure | Friending Bias | |
| Vance County, NC | 22% | 23% | 17% |
| Richmond County, NC | 22% | 23% | 12% |
| Lee County, SC | 22% | 21% | 11% |
| Marion County, SC | 21% | 24% | 13% |
| Saluda County, SC | 21% | 28% | 22% |
| Dillon County, SC | 20% | 24% | 11% |
| Scotland County, NC | 20% | 23% | 15% |
| Marlboro County, SC | 19% | 19% | 9% |
| Robeson County, NC | 18% | 20% | 15% |
| Allendale County, SC | 18% | 17% | 9% |
| SOURCE: The Social Capital Atlas, Chetty (2022a) and Chetty (2022b) NOTES: Higher values indicate more economic connectedness, more exposure to high-SES individuals, and decreased likelihood of forming friendships with high SES. Economic connectedness is the share of low-SES individuals' friends who have high SES, averaged over low-SES individuals in the county. The two determinants of economic connectedness are exposure and friending bias. Exposure is the average share of exposure to high-SES individuals through groups like workplaces, religious organizations, and schools for low-SES individuals in the county. Friending bias represents the tendency of a low-SES individual becoming friends with a high-SES individual, conditional on exposure. It is calculated as 1 minus the share of friends they make in that group who have high SES divided by the share of people in the group who have high SES. | |||
Conversely, counties in large metropolitan areas tend to have less cohesiveness than more rural counties. These counties often have lower support ratios and lower rates of clustering — indicating that an individual's friends are less likely to be friends with one another in these areas. In the Fifth District, counties in West Virginia have some of the highest rates of clustering, while counties in the Washington, D.C., and Raleigh-Durham areas have some of the lowest rates of clustering in the district. (See map below.)
Nationally, county volunteering rates range from 1.4 percent to 27.1 percent. Most Fifth District counties have lower rates than the national median of 7.3 percent. Notable exceptions are Randolph County in West Virginia and Highland County in Virginia, where 20.3 and 18.8 of residents, respectively, are members of at least one volunteering or activism group. (See map below.)
Linking Social Capital to Economic Mobility
The researchers use these data to analyze the role that each form of social capital plays in economic mobility (defined as the average income in adulthood of children growing up in low-income families). Of the three types of social capital, they find that only economic connectedness is positively correlated with economic mobility. Chetty and his co-authors find that economic connectedness is a strong predictor of upward mobility even after controlling for poverty rates, income inequality, and racial segregation.
One explanation for this positive relationship is the influence of economic mobility on economic connectedness — ascending the socioeconomic ladder can lead to increased connections with high-SES individuals. To estimate the extent to which economic connectedness affects economic mobility, rather than the other way around, Chetty and his co-authors calculate connectedness scores for children in each county based on their parents' SES. They argue that economic connectedness scores for this population are not influenced by economic mobility because social connectedness formed in high school precedes workforce entry and the opportunity to advance economic mobility.
Chetty and his co-authors find evidence that economic connectedness may improve intergenerational economic mobility. In other words, children raised in counties where low-income individuals have more high-income friends then have higher incomes in adulthood on average. For example, individuals raised in low-income families in Minneapolis, where economic connectedness is high, have higher incomes when they are 35 years old than those raised in Indianapolis, where economic connectedness is low ($34,300 vs. $24,700). This research reveals the important role that social capital — specifically the type that connects low-SES individuals to high-SES peers — plays in helping people move out of poverty.
Readings
Chetty, Raj, Matthew O. Jackson, Theresa Kuchler, et al. "Social Capital I: Measurement and Associations with Economic Mobility." Nature, August 2022a, vol. 608, no. 7921, pp. 108−121.
Chetty, Raj, Matthew O. Jackson, Theresa Kuchler, et al. "Social Capital II: Determinants of Economic Connectedness." Nature, August 2022b, vol. 608, no. 7921, pp. 122−134.
Subscribe to Econ Focus
Receive an email notification when Econ Focus is posted online.
By submitting this form you agree to the Bank's Terms & Conditions and Privacy Notice.
Contact Us