Experiences and Expectations of Inflation
Macro Minute
June 28, 2022
May's consumer price index (CPI) report brought troubling news to those looking for clear and compelling signs of inflation easing. Monthly headline CPI rose 1 percent in May and 8.6 percent on a year-over-year basis, a new 40-year high. Monthly core CPI — which strips out food and energy prices — rose 0.6 percent in May and 6 percent on a year-over-year basis.
There are two key reasons inflation might differ according to income. First, spending patterns vary by income. Lower-income households, for example, spend more of their income on necessities like housing, food and transportation. Thus, increases in prices of these goods affect a lower-income household's budget more saliently, and these prices have seen significant growth during the pandemic. Lower-income households also spend a greater portion of their income on gas, which was 48.7 percent more expensive in May versus a year ago.
Second, households in different income groups also pay different prices for the same goods, which — according to the 2017 paper "Inflation at the Household Level" — contributes to a higher inflation rate for poorer households. (For further discussion, see the recent Econ Focus article on how people experience inflation differently.)
A recent report by the National Academies' Committee on National Statistics encourages the Bureau of Labor Statistics to identify data sources that would allow the public to better understand differences in inflation by income group. Until then, some of the data we've been tracking in this blog might also provide helpful clues on the inflation experience gap.
In particular, one of our previous posts discussed how survey measures of households' inflation expectations haven't been particularly informative about future inflation. However, year-ahead inflation expectations appear to be very highly correlated with realized inflation. Figure 1 below shows this tight linkage.
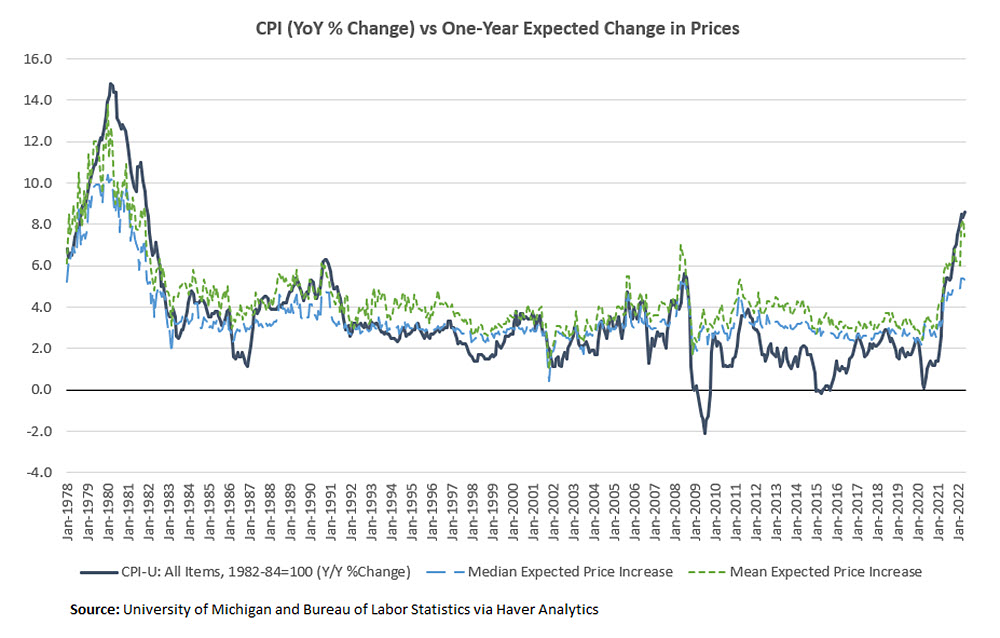
From January 1978 to May 2022, the correlation between the median household's one-year inflation expectation (from the University of Michigan's Survey of Consumers) and actual CPI inflation is 0.915. The correlation between the average household's one-year inflation expectation and actual CPI inflation is nearly identical, at 0.914.
Suppose there is a tight linkage between experienced and expected inflation. Then, higher reported inflation expectations for lower income groups in the consumer survey would suggest that these households have actually experienced higher inflation.
Figure 2 below shows the median year-ahead inflation expectation of households, broken out into income terciles (i.e., the top, middle and bottom third of households, ranked by income).
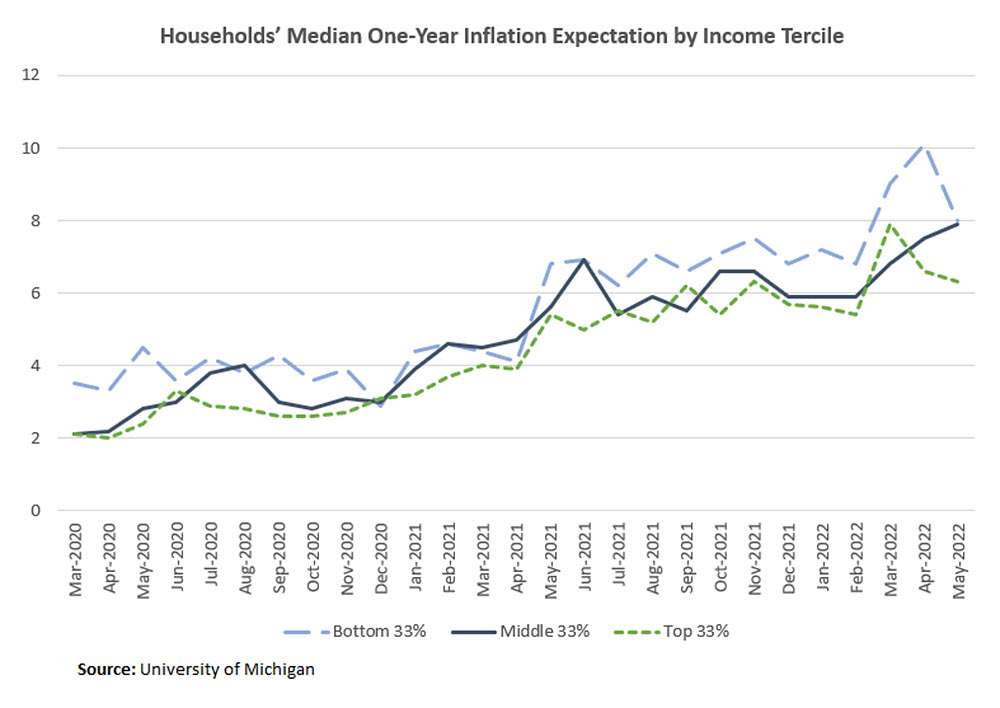
The figure shows that during the course of the pandemic, the median household in the bottom income tercile reported higher expected inflation than those in the middle income tercile, who in turn reported higher expected inflation than households in the top income group.
Another inflation expectation survey by the New York Fed shows similar disparities by income level, with the median one-year ahead expected inflation rate hitting 7.2 percent for households with income under $50,000, compared to under 6.5 percent for other households, as of May 2022.
This ranking gives suggestive evidence that lower-income households have experienced a steeper rise in the cost of living during the pandemic compared to higher-income households. This is in line with the findings (conducted for an earlier time period) of the aforementioned 2017 paper.
Views expressed in this article are those of the author and not necessarily those of the Federal Reserve Bank of Richmond or the Federal Reserve System.
Contact Us