Diving Into Private Fixed Investment
Macro Minute
July 2, 2024
Private fixed investment — which makes up nearly 18 percent of nominal GDP in the most recent data release — rose 6.0 percent annualized in inflation-adjusted terms during the first quarter of 2024. This is up from its initial estimate of 5.3 percent and from 3.5 percent growth in the preceding quarter. As shown in Figure 1 below, this quarterly growth rate was higher than its 2010-2019 average of 5.6 percent but remained within the range of growth rates observed the decade before the pandemic. In today's post, we'll look into the components of private fixed investment and discuss what recent monthly data could be telling us for the outlook for this component of GDP.

The Bureau of Economic Analysis defines fixed investment as investment in assets that can be used to produce goods or services, with the term "fixed" indicating that these assets can be used for at least a year. Table 1 below breaks out private fixed investment into four categories: private residential investment, and three categories of nonresidential investment, namely structures, equipment and intellectual property products (IPP).
| Component | Share of nominal GDP (2024 Q1) | Share of nominal private fixed investment (2024 Q1) | Real QoQ annualized growth (%) | Monthly tracking indicator | Quarterly correlation with monthly tracker |
|---|---|---|---|---|---|
| Residential | 4.0 | 23.0 | 15.4 | Housing permits | 0.81 |
| Structures | 3.1 | 17.6 | 0.4 | Nonresidential construction | 0.77 |
| Equipment | 4.9 | 28.1 | 0.3 | Core capital goods shipments | 0.89 |
| Intellectual Property Products | 5.5 | 31.3 | 7.9 | Prof. and tech. svc. payrolls | 0.76 |
| TOTAL | 17.6 | 100.0 | 6.0 | ||
| Source: Author's calculations using Bureau of Economic Analysis data via Haver Analytics. Components may not sum up to total due to rounding. | |||||
While the Bureau of Economic Analysis (BEA) publishes data on fixed investments at a quarterly frequency, monthly data can give a timelier picture of the outlook for private fixed investment. Table 1 also pairs each component of fixed investment with a monthly economic indicator that moves closely with the quarterly series. These relationships could potentially be used to construct a bottom-up forecast for quarterly investment.
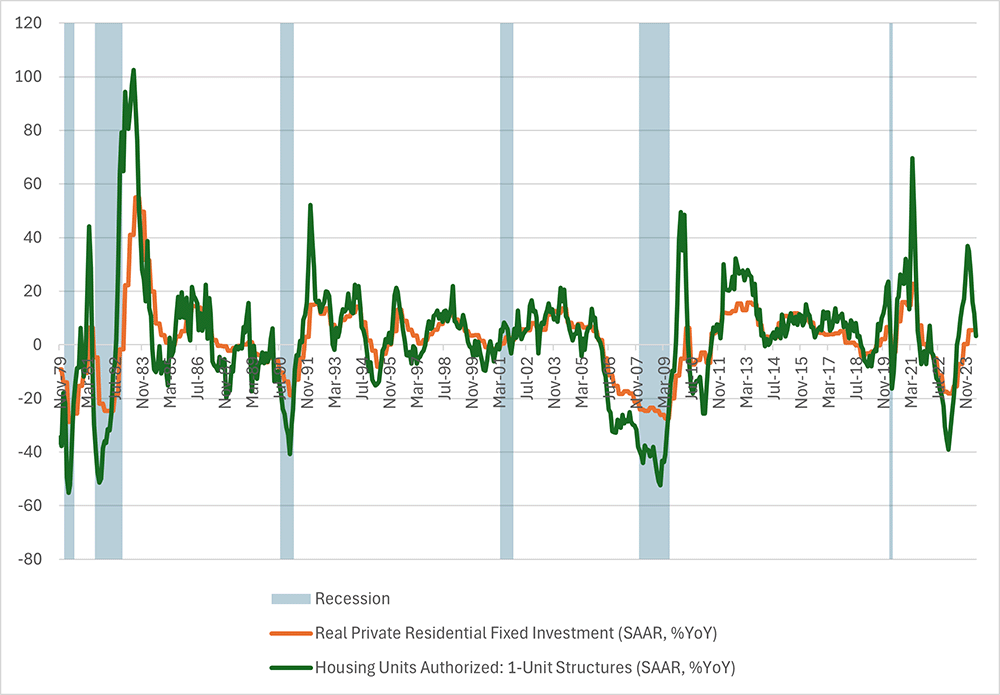
For example, real private residential investment — the first component of private fixed investment we'll examine — is strongly correlated with year-over-year growth in single-family housing permits, with a correlation coefficient of 0.81 between the fourth quarter of 1979 and the first quarter of 2024. Figure 2 focuses on single-family home permits, which accounted for 71.1 percent of all housing units authorized in May 2024 and has averaged 62.4 percent of all housing permits over the past 10 years. The figure shows that this series moved closely together with growth in residential investment.
Recent data indicate a slowing in residential investment growth is likely in the second quarter. In May, housing permits were 3.4 percent higher compared to a year ago, slowing for the fifth straight month and down significantly from the year-over-year growth rate of 36.9 percent observed in December 2023.
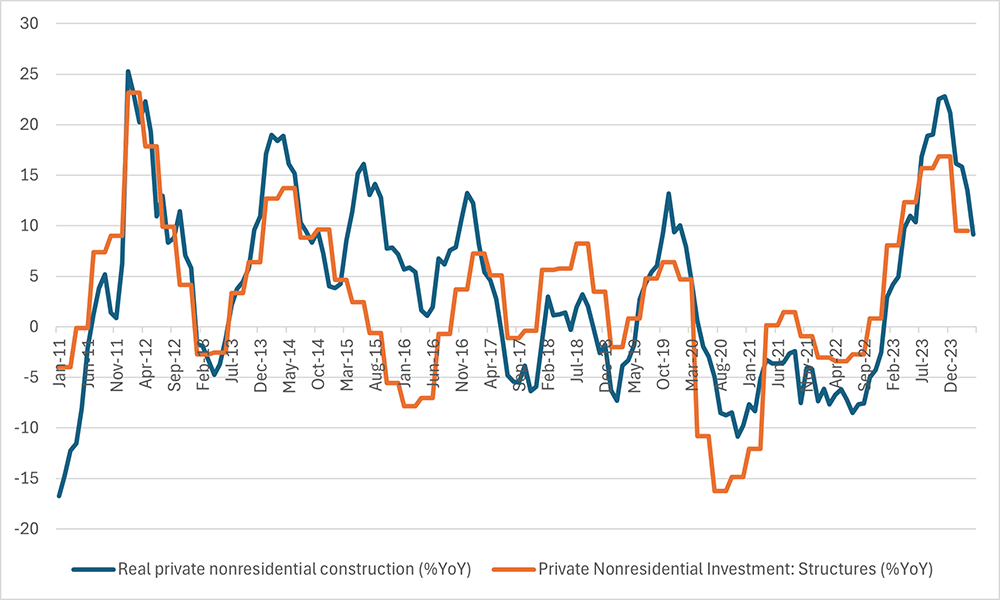
For tracking nonresidential structures investment, monthly data from the Census Bureau on the value of construction done during that month can be leveraged. Figure 3 below depicts monthly private nonresidential construction deflated by the Producer Price Index (PPI) for final demand construction from the Bureau of Labor Statistics, against the BEA's quarterly series for real private nonresidential investment in structures. Both series are expressed as year-over-year percentage changes.
At a quarterly frequency, the correlation between year-over-year growth rates of real nonresidential construction and structures investment was 0.77 between the first quarter of 2011 and the first quarter of 2024. In the latest monthly data from April 2024, real private nonresidential construction was up 9.2 percent over a year ago, with growth slowing for a fifth straight month from a recent peak of 22.8 percent observed in November 2023. While the two series have not always moved in lockstep over the past decade, the recent slowing of nonresidential construction may suggest weaker structures investment could be coming in the second quarter of 2024.
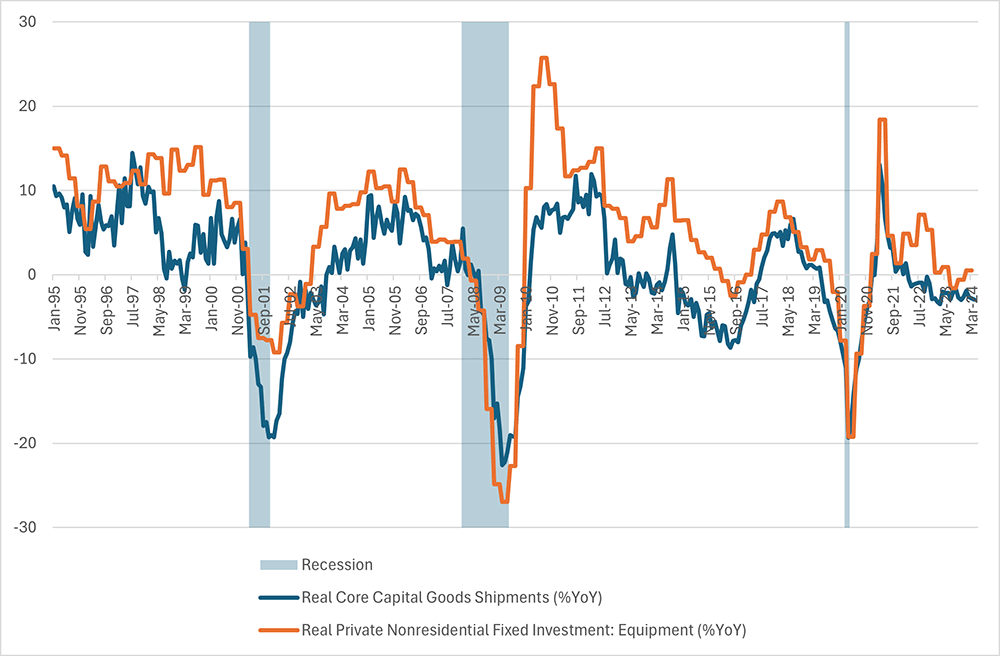
Business equipment investment — which includes investment in information processing equipment, industrial equipment, transportation and related equipment, and other equipment — accounted for 28.1 percent of nominal private fixed investment in the first quarter of 2024. Monthly Census Bureau data on durable goods shipments — adjusted for inflation using the PPI for private capital equipment for manufacturing industries — can be used to track this component of fixed investment.
Figure 4 below shows that year-over-year growth in real shipments of nondefense capital goods excluding aircraft (also known as core capital goods) is highly correlated with year-over-year growth in quarterly equipment investment. Since the first quarter of 1995, the correlation between the two series has been 0.89.
Similar to the previous two components of private fixed investment, recent monthly data could be pointing to a tepid near-term outlook for business equipment investment. Year-over-year growth of real core capital goods shipments has been negative since March 2022, with the most recent April 2024 reading coming in at -3 percent year over year.
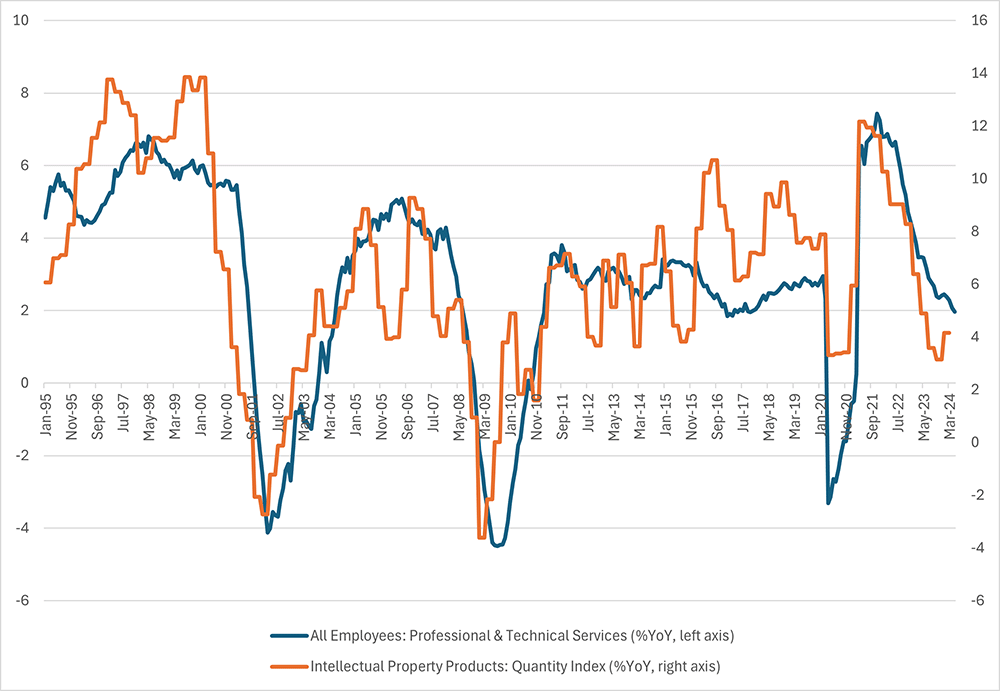
According to the BEA, IPP investment encompasses "research and development, software, and entertainment, literary and artistic originals." In the first quarter of 2024, this category accounted for 31.3 percent of private fixed investment and 5.5 percent of nominal GDP. Because most of these products are not sold in an open market, the BEA measures investment using other measures such as intermediate input costs and employee compensation costs.
Figure 5 below shows how this input cost approach can lead to a correlation between quarterly IPP investment growth and monthly data on growth in professional and technical services payrolls. From the first quarter of 1995 through the first quarter of 2024, the correlation between the two series was 0.76.
However, Figure 5 also highlights that IPP investment growth is more volatile than payroll growth. With increasing attention on the role of AI in the economy, the demand for better data on IPP investment will likewise grow further in the future.
Views expressed in this article are those of the author and not necessarily those of the Federal Reserve Bank of Richmond or the Federal Reserve System.
Contact Us