Broad Spending, Bright Outlook
Macro Minute
January 14, 2025
Consumer spending appears to have closed out 2024 on a positive note, with personal consumption expenditures (PCE) rising by 5.0 percent annualized in November and 6.0 percent annualized over the three months leading to November. Furthermore, anecdotes from retailers — along with high-frequency data from Adobe Analytics and Salesforce — indicate strength continued through December.
Notably, consumer spending has generally remained strong across a wide range of spending categories. In this post, we explore the breadth of consumer spending through a diffusion index, which measures the share of PCE where real spending has risen over a given time frame.
To compute the index, we break down total PCE into 179 subcategories. Within each category, we look at whether real (inflation-adjusted) spending has risen over the past three, six, and 12 months. We construct diffusion indexes by adding up the expenditure weights associated with each category where the growth rate was positive over the period of investigation.
Figure 1 below plots the three-month, six-month, and 12-month diffusion indexes for total PCE. Notably, these indexes appear to decline during recessions (shaded in gray). As of November 2024, the most recent readings for all three indexes are over 80 percent. This indicates that consumer spending remains broad, consistent with an economy in expansion.
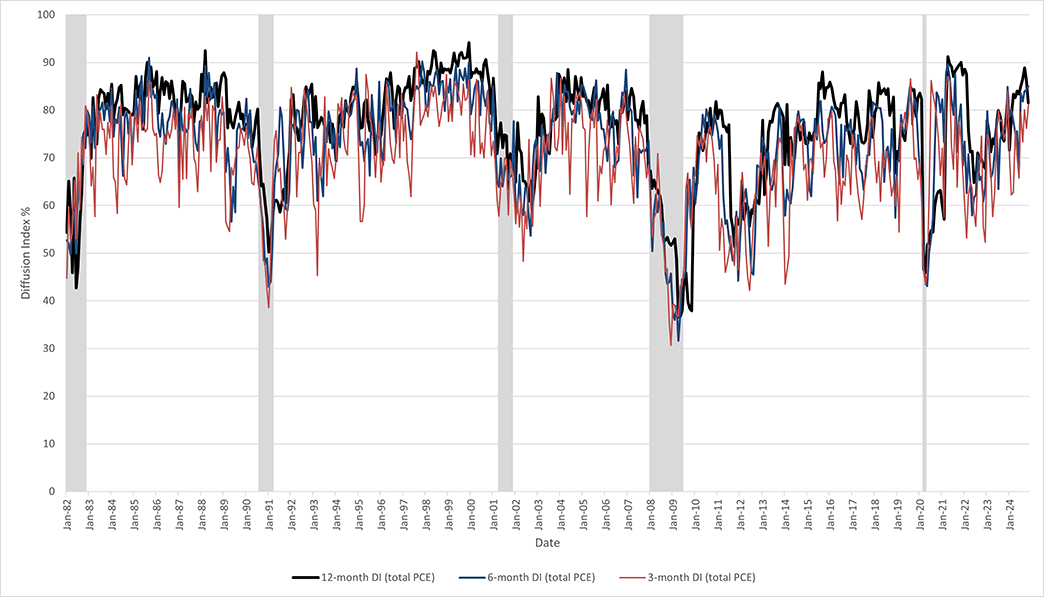
While Figure 1 looks at the breadth of total spending, we can also construct similar indexes for a subset of PCE. In particular, discretionary expenditures — which have accounted for over 69 percent of total PCE over the past four quarters — could be even more responsive to overall economic conditions than overall PCE. For example, households may reduce their purchases of luxury goods in a recession, even as they continue to spend on necessities such as food, gas, and utility bills.
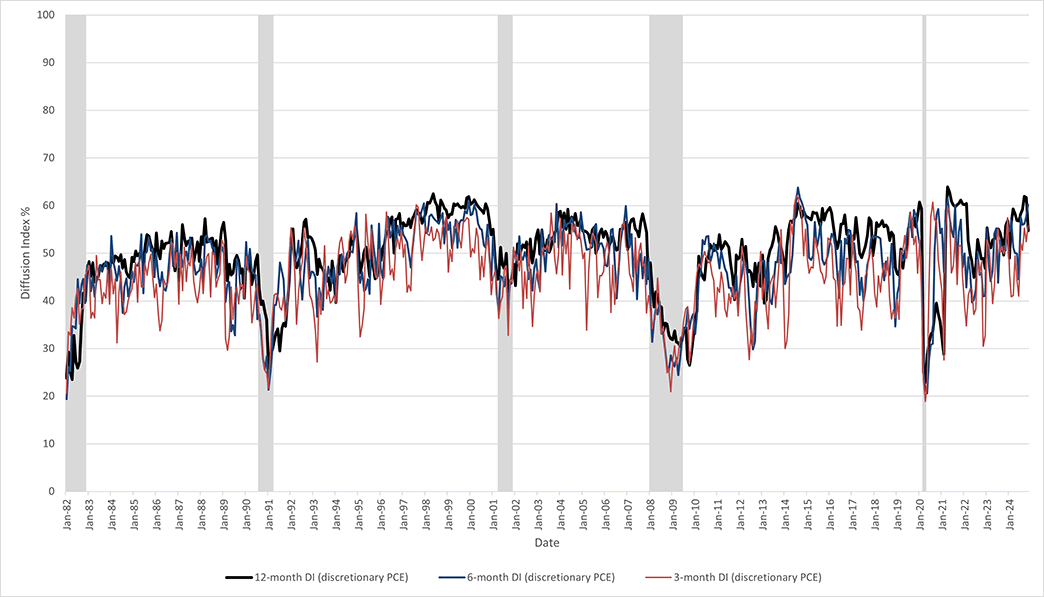
Figure 2 below plots the three-month, six-month, and 12-month diffusion indexes for discretionary spending. For this post, we define discretionary spending as total PCE minus expenditure on food, clothing and shoes, gasoline and energy, and housing services. As of November, all three indexes are above 50, indicating that the expenditure share of discretionary consumption categories in which spending is rising over the periods studied outweighs the expenditure share of the categories where spending has fallen.
These spending diffusion indexes are in principle similar to the Bureau of Labor Statistics' payroll diffusion indexes — which we discussed in a previous post on job gains — and they could perform a similar function as an indicator of overall economic health.
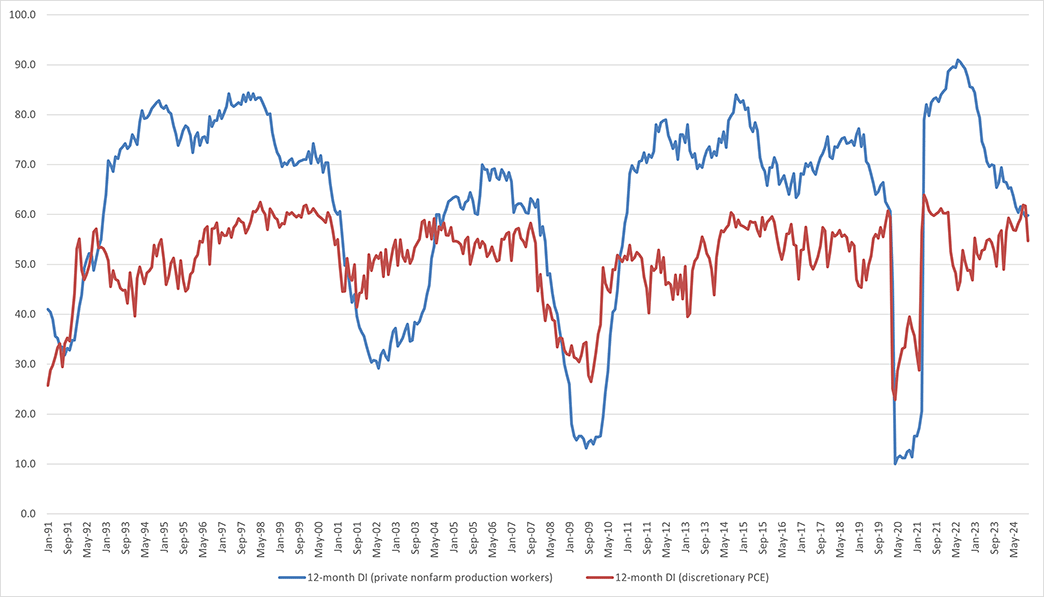
Table 1 below reports the correlations between the expenditure diffusion indexes we computed above and the payroll diffusion indexes computed by the BLS. In all cases, there is a positive correlation, but the payroll diffusion indexes appear to be more correlated with their discretionary PCE counterparts than with the total PCE diffusion indexes. The highest correlation is between the 12-month payroll diffusion index and the 12-month discretionary PCE diffusion index, with both indexes plotted in Figure 3 below. Based on the breadth of consumer spending depicted by these measures, the U.S. consumer is likely to have entered 2025 in robust shape.
| 3 mo payroll DI & 3 mo total PCE DI | 0.38 |
|---|---|
| 3 mo payroll DI & 3 mo discretionary PCE DI | 0.40 |
| 6 mo payroll DI & 6 mo total PCE DI | 0.48 |
| 6 mo payroll DI & 6 mo discretionary PCE DI | 0.53 |
| 12 mo payroll DI & 12 mo total PCE DI | 0.57 |
| 12 mo payroll DI & 12 mo discretionary PCE | 0.63 |
| Source: Authors' calculations using Bureau of Economic Analysis and Bureau of Labor Statistics data via Haver Analytics | |
Views expressed in this article are those of the author and not necessarily those of the Federal Reserve Bank of Richmond or the Federal Reserve System.
Contact Us