New Year, New Me, New January PCE
Macro Minute
February 4, 2025
Last week's personal consumption expenditures (PCE) inflation report for December yielded further evidence of moderate core inflation pressure. Headline PCE rose 0.3 percent month over month, taking the 12-month headline inflation rate to 2.6 percent. However, core PCE prices rose only 0.2 percent month over month, leaving the 12-month core inflation rate at 2.8 percent.
Will January bring further news of continued moderation, or could we be in for a surprise? In this week's post, we look back through history to show how previous January inflation reports have displayed more volatility compared to inflation readings in other months.
To explore the volatility of monthly inflation, we compute descriptive statistics on monthly seasonally adjusted consumer price index (CPI) and PCE inflation rates from the Bureau of Labor Statistics and Bureau of Economic Analysis, respectively. Although these data are seasonally adjusted, they may still display variation over the course of the calendar year due to factors that fall outside of the typical seasonal pattern, such as extreme weather or supply chain shocks. Our analysis does not imply that there is residual seasonality in the data. We focus on data from January 1995 through February 2020, a period when average inflation was close to the Fed's current target of 2 percent average inflation (when data were more likely to be comparable over time) and predating the COVID-19 pandemic.
Figure 1 below shows boxplots constructed for monthly core PCE inflation rates, arranged by month. Each boxplot represents the distribution of inflation rates for its respective month. The top border of the box represents the 75th percentile of the data, the middle line represents the median, and the bottom border represents the 25th percentile. Extending from the top and bottom borders of the box are two vertical lines: The top vertical line extends from the 75th percentile through the maximum of the data (excluding outliers), while the lower vertical line extends from the 25th percentile to the minimum (excluding outliers). Outliers (if any) are any data points more than 1.5 times the interquartile range above or below the box and are depicted by dots in Figure 1. We normalize the data by subtracting each month's median monthly inflation rate so that the boxplot is centered around zero. This adjustment specifically highlights deviations from the median, providing an insight into how the distribution of core PCE varies across months.
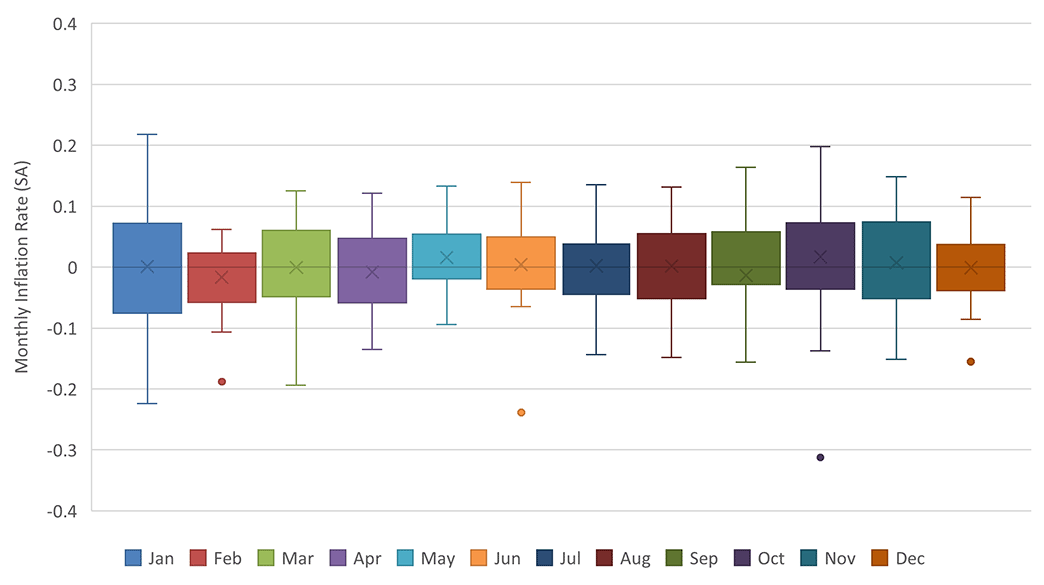
Figure 1 shows that, over the sample period, monthly core PCE inflation generally fell within 0.2 percentage points around the median across all months. However, January and October exhibit greater dispersion as evidenced by the relatively longer whiskers surrounding their boxes. The figure also indicates the presence of outliers in September and October. These outliers, though, reflect the impact of the 9/11 attack, when extreme fluctuations in life insurance drove monthly core PCE inflation.
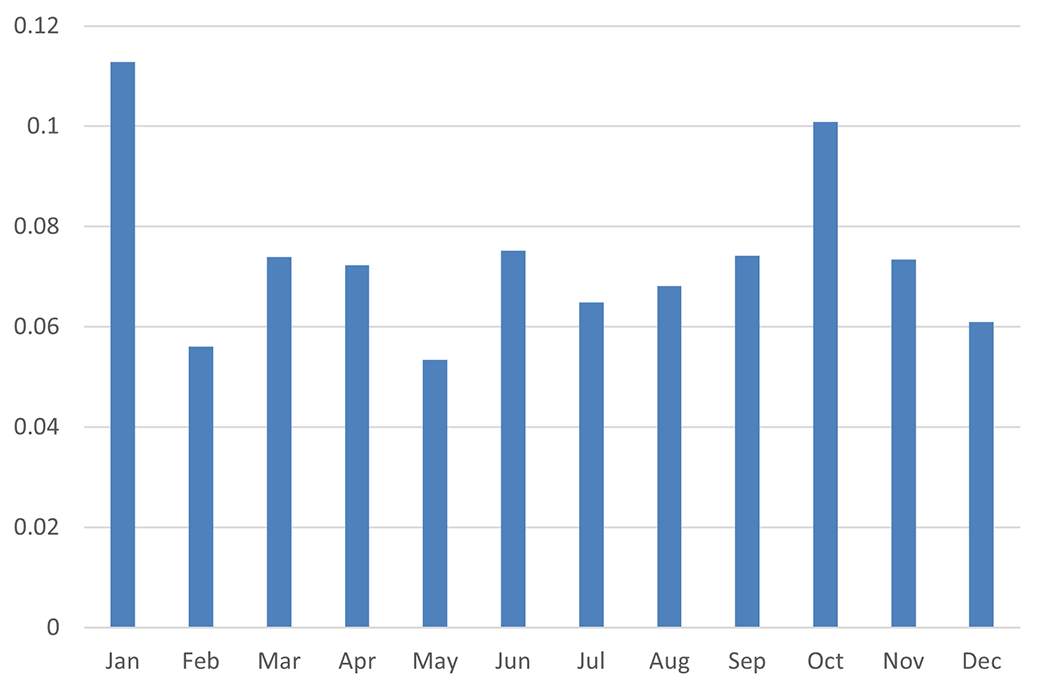
Excluding the outliers associated with this event, we calculate the standard deviations for each month as another way of visualizing the dispersion in monthly core PCE inflation readings. Figure 2 below depicts a bar graph of these monthly standard deviations. As suggested by the previous figure, January and October demonstrate higher variation in monthly core inflation compared to other months' inflation readings.
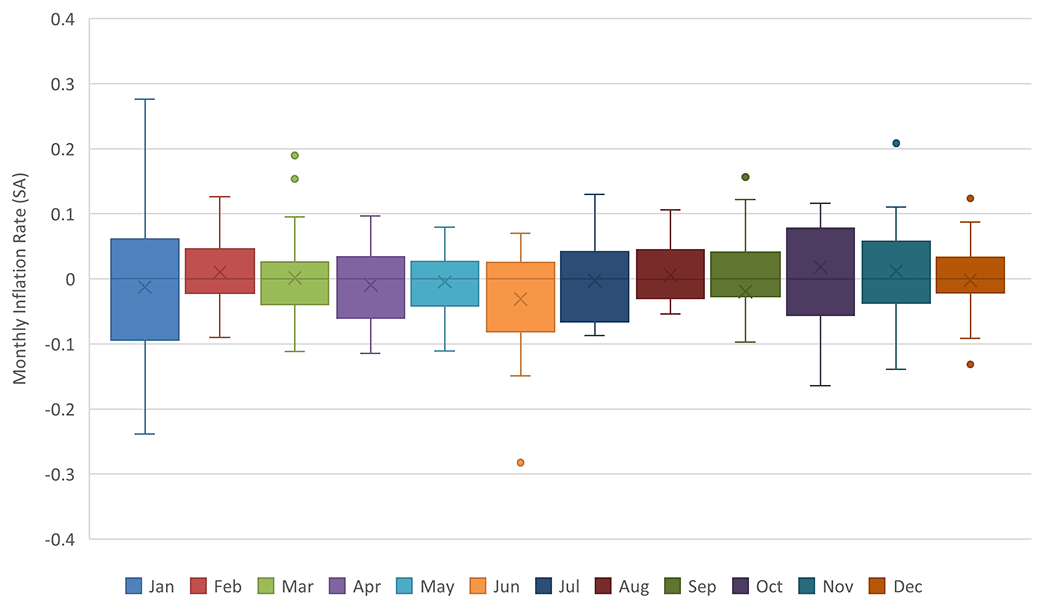
Greater variability in inflation readings in January can make it difficult to forecast inflation in that month based on inflation signals in the CPI report, which is typically published two weeks ahead of the PCE inflation report. We illustrate this in Figure 3, which shows monthly boxplots of the core inflation wedge: the difference between monthly core PCE inflation and monthly core CPI inflation. These differences are normalized as in Figure 1.
In most months, the core inflation wedge has generally fallen between -0.10 and 0.10 percentage points of its corresponding monthly median. However, January stands out as an outlier: The distribution of January's core inflation wedge ranges from roughly -0.25 to 0.30 percentage points of its median.
What do these findings mean for parsing the upcoming January inflation reports? There may be a few takeaways. First, given the large variability of January's core inflation wedge compared to other months, it may be prudent not to place too much weight on January's CPI inflation signals when forecasting PCE inflation for January. Second, given the higher variability of January's core PCE reading compared to other months, it's prudent to remember that any surprises — in either direction — are not necessarily indicative of inflation momentum for the remainder of the year.
Views expressed in this article are those of the author and not necessarily those of the Federal Reserve Bank of Richmond or the Federal Reserve System.
Contact Us