Skip to Main Content

The Housing Market and the Pandemic

Econ Focus
Fourth Quarter 2020
District Digest
Outer Banks housing
Like many Fifth District locations, North Carolina's Outer Banks has seen a jump in home sales and a decline in inventory since 2019.

Housing construction and sales activity matter a great deal to the U.S. economy as a whole, as they account for 4 percent of gross domestic product (GDP). On an individual level, too, the housing market is economically important; the largest asset holding of many Americans is their house. Thus, economists and policymakers at the Richmond Fed and other institutions closely track housing market activity through a variety of indicators.

While the housing market is integral to the economy, it does not perform the same way in every economic downturn. For example, weakness in the housing market was a major contributor to the Great Recession of 2007-2009, but that was not the case for the current pandemic-induced downturn. In addition, while the housing market continued to weaken throughout the Great Recession, it has remained relatively strong this year despite the significant decline in overall economic activity and the spike in unemployment in the spring. Both in the United States as a whole and in the Fifth District, the housing sector has done better than other industries, such as leisure and hospitality, that were more directly affected by the virus (such as through shutdowns). There were some negative effects on the housing market early in the downturn in terms of new construction and home sales, but both quickly bounced back in the summer. Demand for homes has been strong through most of 2020, and house price growth has remained solid throughout the year.

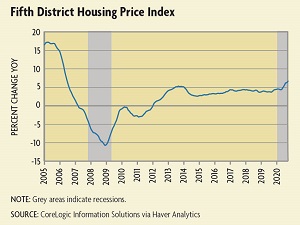
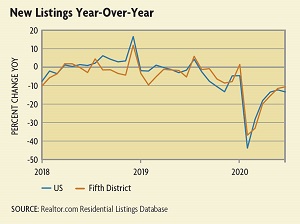
As it does in other times, the Richmond Fed has been monitoring how the housing market has fared in the pandemic. Measures of housing prices are among some of the best gauges of the strength of the residential real estate market; they reflect demand and supply in the market and underlying influences such as interest rates and access to mortgages. Housing construction can be examined in terms of its contribution to economic growth and employment. Data on new permits and housing starts provide insight into housing supply. With respect to selling a house, there are also data available on the current number of listings and the average time it takes to sell. The Richmond Fed also relies on observations from real estate agents within the Fifth District for a better understanding of what buyers and sellers are experiencing in the market and expect to see in the future.

Our Related Research

Residential Investment

The economic situation in the United States in the second quarter of 2020 was marked by shutdowns and uncertainty, and the housing market naturally was affected. According to the Bureau of Economic Analysis, residential fixed investment at the national level (spending on new construction, improvements, and activities related to sales transactions) fell by 35.6 percent at an annualized rate in the second quarter of 2020. During that time, spending and investment weakened in many industries, as overall GDP in the second quarter fell 31.4 percent at an annualized rate. The decrease in construction spending led to a decrease in employment in the construction market as well. Employment in the construction industry fell by 13.4 percent in the United States and 5.8 percent in the Fifth District in April. A large share of this came from the residential side, as employment nationally in residential contracting fell 14.9 percent (11.5 percent for single-family homes) and employment in residential specialty trade fell by 14.7 percent in April.

The third quarter saw economic recovery, as GDP rebounded by 33.1 percent, although it remained below its first-quarter level. Contributing to this overall GDP recovery was recovery in the housing market, which was evident as residential fixed investment increased by 62.3 percent at an annualized rate, surpassing its first-quarter value. Much of the rebound observed in the data can be attributed to broker's commissions and ownership transfer costs, reflecting the significant increase in home sales activity over the summer.

On the employment side, the construction industry rebounded quickly and has seen an overall gain of jobs, both nationally and in the Fifth District, every month since April. In November, employment in residential building and specialty trades was nearly back to pre-pandemic levels. November employment in the residential construction industry was up 17.2 percent since April in the United States. The story of weakening and rebounding employment in construction has also been echoed by the Richmond Fed's business contacts in the Fifth District.
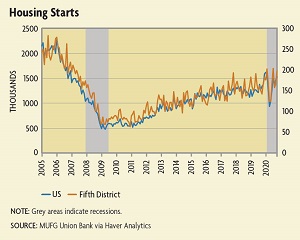
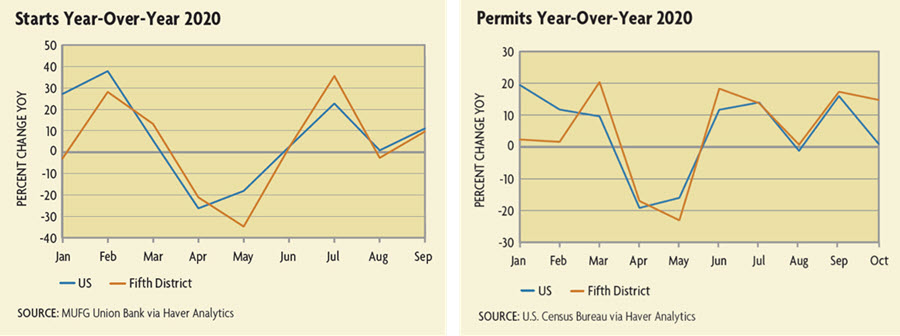
Starts and Permits

Spending on residential construction depends on houses being built, which is why market observers look at residential permitting data. The U.S. Census Bureau releases monthly data on the number of housing permits issued at the national and state level and the number of housing starts nationally. State-level data on the number of housing starts — actual construction — are published by MUFG Union Bank.

Data on both starts and permits show early or anticipated demand for housing and are indicative of what home supply will look like in the coming months. Permits can be viewed as leading indicators for starts and starts as leading indicators for completions. For an idea of a typical lag from this time until a house is on the market, according to the U.S. Census Bureau, in 2019 the average time between issuing a housing permit and the start of construction was just over a month and the average time between a start and completion of the home was seven months.

At the beginning of 2020, before the pandemic reached the United States, the housing market was strong. In January 2020, the United States saw the most housing starts since December 2006 at a seasonally adjusted rate. (See chart.) In February, the Fifth District also saw the most housing starts since before the Great Recession, reaching its highest reading since March 2007. When the pandemic initially hit, housing activity, like other economic activity, contracted as both housing starts and housing permits fell sharply in both the nation and the Fifth District in the second quarter. Construction was named an essential industry in most localities during shutdowns, allowing work on houses to continue — in theory. But many of the Richmond Fed's business contacts reported delays from state and local permitting offices, as well as supply chain disruptions, such as shortages of lumber, appliances, and specialized labor.

Fortunately, the contraction in residential construction activity was short-lived. After softness in April and May, housing starts and permits increased substantially in the third quarter, with the number of permits issued rising year-over-year by 18 percent in the Fifth District in June; one month after this permit growth, the number of starts went up 36 percent on a year-over-year basis in the Fifth District in July. (See charts below.)

Prices

A widely used way to measure housing price growth is a house price index (HPI), such as the one provided by CoreLogic Information Solutions. An HPI is a repeat sales index, which tracks changes in housing price levels by looking at the selling prices of homes that have been sold in the past and comparing sale prices over time. The HPI provided by CoreLogic Information Solutions is released monthly and deals solely with single-family homes. According to these data, residential real estate prices in the Fifth District have generally followed national trends over the years. House price growth has been positive since 2012 in both the nation and the Fifth District and is currently around the 5 percent to 6 percent range, on a year-over-year basis, for both. The CoreLogic HPI indicates that there has not been a deceleration in housing price growth during the pandemic at either the national or the Fifth District level. In fact, from October of 2019 to October of 2020, home prices were up 7.4 percent in the United States and 6.7 percent in the Fifth District.

Perhaps one of the most notable trends in housing prices in 2020 was the stability of growth even as the economy changed. Looking back over the past several decades, house prices have generally softened during a recession, but house price growth has stayed fairly stable in 2020 or even increased. (See chart.) In addition to fairly strong demand, strong prices in 2020 can be partially attributed to low supply. Data from Realtor.com show that the number of active listings has fallen throughout the year, in part because new listings have been relatively low. In April, the first month fully affected by the pandemic-related restrictions in the United States, new listings were down year-over-year by 44 percent in the nation and 37 percent in the Fifth District. (See next chart.) Real estate agents reported that people were reluctant to go to viewings or show their homes for fear of exposure to the virus in the second quarter and were also hesitant to make significant purchases or moves in a time of great economic uncertainty.

An alternative measure of house prices is median list price. These data are provided monthly by the National Association of Realtors and are available through Realtor.com. They show an upward trend in list prices throughout 2020. After a slight slowdown in the spring, price growth accelerated, reaching a rate of 14 percent nationally on a year-over-year basis in July. Even more notable than original list prices have been price adjustments. The percentage of sellers reducing prices on their homes has remained relatively low throughout 2020 compared with the last few years. In addition, instances of price increases have risen dramatically since the spring, indicating that high demand and tight supply are pushing up selling prices of homes to higher levels than their original listing prices. (See next chart.) The story of high demand and low supply is also supported by data that the median days on the market for a home in 2020 has actually been falling. While there is some seasonal pattern to days on the market, in 2020, the time to sale has remained relatively short throughout the year.

Mortgages

Many factors, of course, influence housing demand. Demographics and lifestyle changes certainly play a role, but affordability is also critical. Most prospective buyers need to finance their homes in order to purchase, and low mortgage rates can make buying a home more affordable. Affordability of mortgages, can, in turn, put upward pressure on selling prices and increase the number of sales. For this reason, it is important to consider mortgage rates in the story of demand in the housing market. In an effort to boost the economy during the pandemic, the Federal Open Market Committee (FOMC) has kept interest rates low, cutting the target for federal funds rate to zero to 25 basis points on March 15, where it has remained since. At the same time, the FOMC restarted purchases of mortgage-backed securities, or MBS, providing more stability in the mortgage market, and thus making mortgages more affordable. (The Fed purchased large amounts of MBS to support the housing market during and after the Great Recession.) This has led to exceptionally low mortgage rates in 2020. Data from Freddie Mac indicate that average mortgage rates in the United States have generally been trending downward throughout the pandemic and are now below 3 percent, the lowest they have been in nearly 50 years.

But with regard to the housing market, low interest rates are moot if homebuyers cannot qualify for a mortgage. For this reason, mortgage access plays a significant role in the housing market, as not being able to obtain a mortgage will remove buyers from the market, weakening demand. In the spring and summer of 2020, some buyers experienced difficulty obtaining mortgages. The Mortgage Credit Availability Index, published monthly by the Mortgage Bankers Association, tracks accessibility of mortgages. This index is calculated using measures of borrower eligibility such as credit score, loan type, and loan-to-value ratio. The index fell drastically during the pandemic and in November was 32.5 percent lower than it was in February, meaning that the terms and borrowing qualifications on the average loan had become more rigorous. This suggests that buyers have experienced increasing difficulty obtaining mortgages in 2020, in line with anecdotal accounts. In addition to any weak conditions on the buyer side, there have been reports that lenders have set higher standards for mortgages in 2020. Evidence of this trend was seen by the Urban Institute's Housing Finance Policy Center, which reported a decline in mortgage credit availability in the second quarter of 2020. The increased stringency in requirements to qualify for a mortgage this year has kept some potential homebuyers out of the market, weakening demand, but the market has remained resilient despite this.

The ability or inability to make payments on existing mortgages is also part of the story, as mortgage defaults and foreclosures affect the supply of houses for sale. While mortgage qualification standards may have risen for buyers, many people who already owned homes and had mortgages were also hurt financially by the pandemic. These trends are not unrelated, as more default risk in the mortgage market encourages stricter lending standards. According to the New York Fed, about 70 percent of household debt in the United States is housing-related debt, making mortgage debt a significant factor in the personal finances of many Americans. As often happens with a downturn in the economy and an increase in unemployment, mortgage delinquency rates rose sharply in the second quarter of 2020. The percentage of mortgages past due in the United States jumped from 4.4 in the first quarter to 8.2 in the second quarter. Mortgage delinquencies can be informative about personal finances and the general ability of owners to afford to stay in homes. If homeowners cannot pay their mortgages and lenders foreclose on them, their houses go on the market, adding to supply, and they must look for a new place to live. Mortgage defaults create personal financial hardship and can also be disruptive to the broader financial system if lenders are unable to collect on debts.

When the pandemic hit the U.S. economy, Congress addressed the problem of mortgage delinquencies through a federal forbearance program in the Coronavirus Aid, Relief, and Economic Security (CARES) Act, which was signed into law on March 27. Under the CARES Act, anyone who faced financial difficulties because of the pandemic could defer mortgage payments for 180 days without penalties or extra fees. This deferment could be extended for an additional 180 days. (See "The Coronavirus Crisis and Debt Relief," Econ Focus, Second/Third Quarter 2020.) The program helped those who could not make payments during the downturn to stay in their homes, eased home-owners' financial distress, and promoted stability in the lending market by reducing defaults. Reducing defaults also supported housing prices by preventing an influx of homes for sale into the market. At the same time, forbearance programs have led lenders to be more cautious and create more stringent requirements for borrowers, making it more difficult for many current prospective buyers to obtain mortgages.

Changing Landscapes

The pandemic has affected preferences for locations and living arrangements, including homeownership. In particular, the spread of the virus in crowded urban areas seems to have made living in less densely populated areas more attractive, at least for now. Similarly, as many businesses have transitioned to remote work, whether temporarily or for the long term, the need to be close to one's place of employment, often in cities, has decreased, which can make relocation from urban to suburban or rural areas a more plausible option.

Companies are now aware of the ability of many employees to work remotely and may want them to continue to do so in some capacity, even after the threat of COVID-19 is gone. In the third quarter release of The CFO Survey, conducted by researchers at Duke University, the Richmond Fed, and the Atlanta Fed, 68 percent of surveyed firms said they had a greater share of their workforce working remotely than before the pandemic, and 39 percent of those firms did not intend to return to their pre-pandemic share of workers in the office.

Remote work can affect not only where workers choose to locate, but also what they look for in a home. Richmond Fed business contacts have reported that demand for home offices, pools, personal gyms, and big yards has been increasing among homebuyers since the summer. This trend could lead to a change in the types of homes in demand, and thus being built, and can contribute to renovations of existing homes. Demand for renovations already seems to have increased, according to the strong growth in spending in home improvements seen in the third quarter GDP report. However, it is not clear how much of this can be attributed to new housing needs as opposed to reallocation of spending from other services during the pandemic.

Conclusion

While 2020 has been a year with significant economic weakness and unprecedented drops in certain areas, the housing market has fared relatively well. Prices have grown amid strong demand and low supply. Residential construction spending and employment have both bounced back after declines in the spring. Demand continues to be spurred by low mortgage rates. While the pandemic has brought financial hardship to many homeowners, mortgage forbearance programs have helped financially distressed homeowners remain in their homes. The strength in the housing market has been a bright spot for a struggling economy, contributing to overall economic recovery and jobs, as well as personal financial stability.

At the same time, 2020 has been a year of much uncertainty in many areas: health, job security, how long the economy will take to recover, and whether businesses will continue to use remote work models. All of these factors can profoundly influence decisions about home purchases. The unique conditions that have supported the housing market during this recession and the permanent economic shifts that result from the pandemic are sure to affect home construction and sales in the coming years.

Subscribe to Econ Focus

Receive an email notification when Econ Focus is posted online.

Subscribe to Econ Focus

By submitting this form you agree to the Bank's Terms & Conditions and Privacy Notice.

Phone Icon Contact Us

David A. Price (804) 697-8018